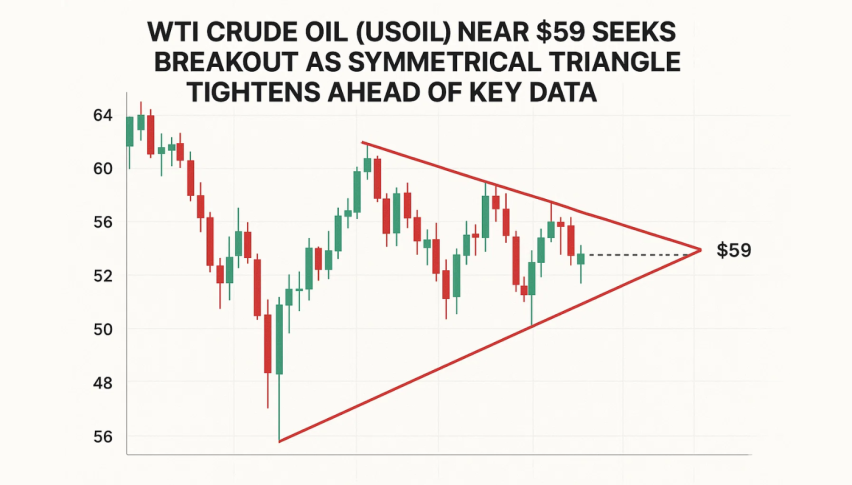
WTI Crude Oil (USOIL) Near $59 Seeks Breakout as Symmetrical Triangle Tightens Ahead of Key Data
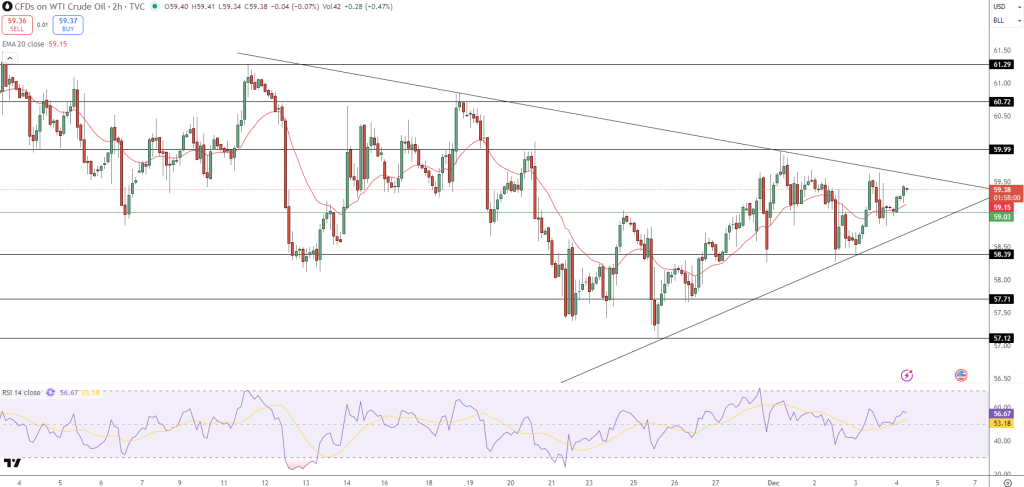
WTI crude oil hovered near $59.38 during Thursday’s session, with traders watching a narrowing technical pattern that often precedes...
Quick overview
- WTI crude oil is currently trading around $59.38, with traders observing a symmetrical triangle pattern that indicates potential volatility ahead.
- The price is constrained between a rising trendline and a descending trendline, with key resistance at $59.99 and support at $59.03.
- Short-term momentum indicators suggest caution, as the market awaits a catalyst for direction, with the RSI showing slight bullishness.
- A breakout above $59.99 could signal bullish continuation, while a failure to maintain the rising trendline may shift sentiment towards bearishness.
WTI crude oil hovered near $59.38 during Thursday’s session, with traders watching a narrowing technical pattern that often precedes a sharp directional move. The market has spent the past several days coiling inside a symmetrical triangle, reflecting uncertainty ahead of new US economic data and ongoing geopolitical noise.
Price Consolidation Within Triangle Pattern
The current structure shows price trapped between a rising trendline from November’s lows and a descending trendline from the late-November rebound. This tightening range signals a buildup in pressure, with recent candles showing smaller bodies and repeated upper-wick rejection near $59.99, a level where sellers have stepped in consistently.
On the downside, the nearest support rests at $59.03, with a deeper pivot at $58.39. A clean break beneath the rising trendline could send WTI toward $57.71, followed by $57.12, marking the next meaningful demand zones.
Momentum Indicators Show Caution
Short-term momentum remains muted. The 20-EMA at $59.15 has flattened, suggesting buyers are losing an edge as the market waits for a catalyst. Meanwhile, the RSI at 56 leans slightly bullish but doesn’t yet show the momentum needed to confirm a trend shift.
Key signals traders are watching:
- Price reaction if $59.03 is retested
- Whether RSI climbs above 60
- A confirmed breakout above $59.99
- Volume expansion during any triangle break
WTI Crude Oil (USOIL) Breakout Levels to Watch
A decisive push above $59.99 would be the market’s first sign of bullish continuation. If confirmed, upside targets include $60.72, a prior reaction zone that could attract fresh buying interest.
Conversely, failure to hold the rising trendline may shift sentiment toward the bears. Until then, the triangle structure keeps WTI in a wait-and-see mode.
- Check out our free forex signals
- Follow the top economic events on FX Leaders economic calendar
- Trade better, discover more Forex Trading Strategies
- Open a FREE Trading Account
- Read our latest reviews on: Avatrade, Exness, HFM and XM