Solana Approaches Critical Breakout at $131 as ETF Inflows Near $1B Despite Validator Crisis
At $131, Solana (SOL) is stabilizing within a falling wedge pattern as network fundamentals are under increasing strain due to a major
Quick overview
- Solana's price is stabilizing at $131 within a falling wedge pattern, despite a significant decline in its validator count by 68% over the past two years.
- Institutional demand for Solana remains strong, with $33.6 million inflows into Solana ETFs last week, contributing to a total of $907 million in assets under management.
- Technical indicators suggest a potential bullish breakout towards $160, but failure to break the upper trendline could lead to a drop to key support levels around $121.66.
- On-chain metrics indicate rising stress among holders, with short-term holders experiencing significant losses, raising concerns about market sentiment.
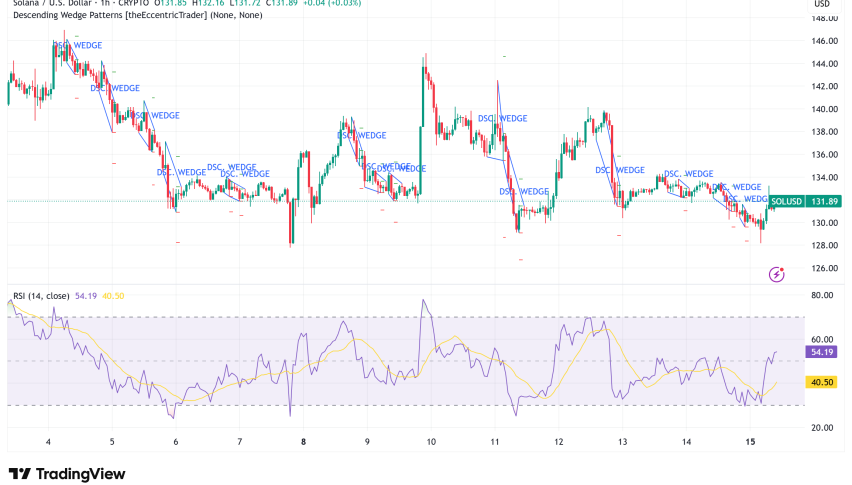
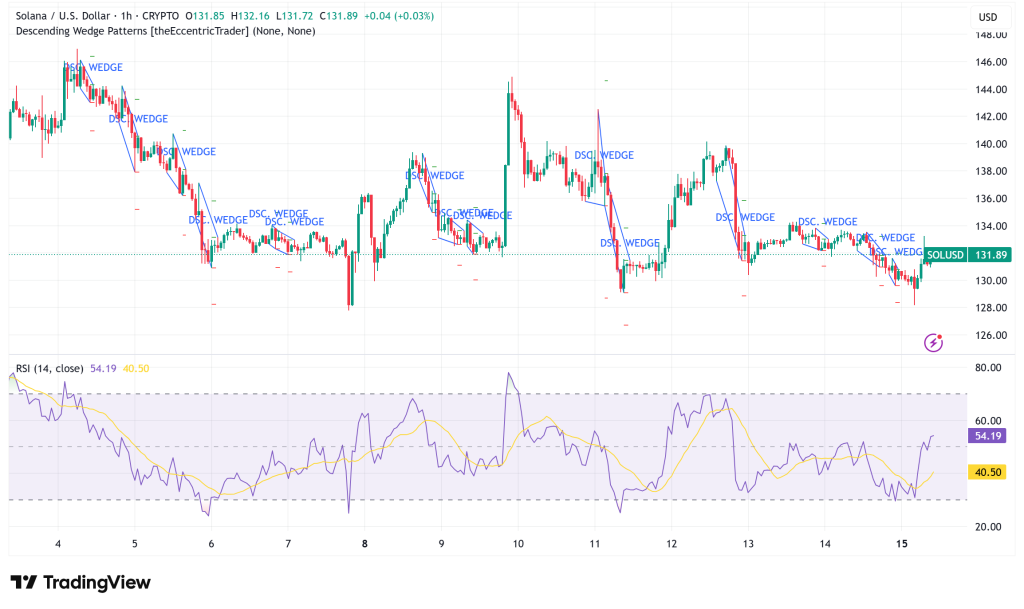
At $131, Solana SOL/USD is stabilizing within a falling wedge pattern as network fundamentals are under increasing strain due to a major flight of validators, while institutional demand is soaring through spot ETF inflows.
Institutional Appetite Remains Strong Through Solana ETF Demand
With spot ETF products exhibiting exceptional consistency, the institutional story for Solana keeps getting stronger. Since its inception on October 28, Solana ETFs have seen positive net inflows every week, according to SoSoValue data. As of Monday, the total assets under management were $907 million.
As part of a larger trend that saw $209 million go into Ethereum products and $287 million go into Bitcoin ETFs, $33.6 million go into Solana ETFs just last week. It appears that intelligent money sees current market levels as an alluring entry moment rather than a warning to exit, as seen by the institutional investors’ selective capital allocation before to year-end.
Even though SOL is down 37% this quarter, the consistent inflows at a time of price consolidation point to a traditional dip-buying approach by institutions, who seem to be looking past short-term volatility toward Solana’s long-term potential.
Solana Network Health Concerns Cloud the Outlook
But beneath the surface of institutional accumulation and optimistic technicals lurks a concerning fundamental development. Over the last two years, Solana’s validator count has fallen by 68%, to about 800 active nodes. There are valid concerns regarding decentralization and network security in light of this sharp reduction.
The economics behind this departure of validators are striking: the amount of SOL needed to break even has tripled, and each block now costs almost $17 million. The financial sustainability of operating validators has drastically declined as SOL’s price has suffered, showing its worst quarterly performance since Q2 2022 with a 50% decrease from its $250 top.
Holders’ stress levels are rising, according to on-chain measures. The Net Unrealized Profit/Loss for short-term holders has fallen precipitously into negative territory, signifying textbook surrender. Given that their NUPL is declining back to the April levels that previously caused a 30% price drop, even long-term holders are displaying indications of weariness.
SOL/USD Technical Analysis: Bullish Technical Setup Points to $160 Target
As it gets closer to the top limit of a falling wedge pattern that has outlined its course since early October, Solana’s price action offers an attractive technical picture. Technical indications are starting to line up in favor of bulls, and this consolidation pattern usually ends with an upside breakthrough.
On the daily chart, the Relative Strength Index has increased to 42, indicating that bearish momentum is waning as it moves progressively toward the neutral 50 level. A rally towards the next major resistance around $160, which might represent a 22% gain from current levels, could be sparked by a clear break over the wedge’s upper trendline.
CoinGlass’s derivatives data supports this optimistic argument by showing that SOL’s long-to-short ratio hit 1.07, the highest level in much in a month. Despite recent price weakening, this ratio over one shows that traders are positioned for upside, indicating increased confidence.
Solana Price Prediction: Breakout or Breakdown?
A breakout possibility is favored by the technical setup. The road to $160 opens up really rapidly if SOL clears the falling wedge pattern aggressively and with high volume. Reduced resistance above that point might quicken the pace toward $180–$200.
However, there is a chance of failure if you don’t break out. If the upper trendline is rejected, SOL may return to the November 21 low, or key support, at $121.66. A breach below this level might shake out any remaining weak hands and probably result in a retest of the $110–$115 range.
- Check out our free forex signals
- Follow the top economic events on FX Leaders economic calendar
- Trade better, discover more Forex Trading Strategies
- Open a FREE Trading Account
- Read our latest reviews on: Avatrade, Exness, HFM and XM