Snowflake (SNOW) Stock Pulls Back After Parabolic Surge — What Comes Next?

Quick overview
- Snowflake Inc. has experienced a significant 162% rally followed by a 25% corrective pullback, currently holding at the 0.382 Fibonacci support level of $214.
- The stock's technical outlook remains cautiously bullish, supported by a golden crossover on the weekly chart, despite mixed momentum indicators.
- Key resistance levels to watch include $237.5 (50-day EMA) and $310 (golden ratio resistance), while critical support levels are at $205 and $170.
- As long as SNOW remains above $170, the broader bullish structure is intact, with potential for a long-term trend reversal if it breaks above $310.
Snowflake Inc. is a U.S.-based cloud data platform that enables fast, scalable data storage and analytics across AWS, Microsoft Azure, and Google Cloud, allowing multiple users to access and analyze data simultaneously with minimal latency.
Snowflake (SNOW) surged approximately 162% from mid-2024 into last month, followed by a 25% corrective pullback.
The stock delivered an exceptionally strong rally over this period; however, despite the magnitude of the move, SNOW failed to reach and decisively break the golden ratio resistance near $310, which remains a critical level for confirming a long-term trend reversal and fully ending the broader bear trend.
Following this rejection, the price corrected roughly 25%, pulling back into the 0.382 Fibonacci retracement level around $214. This level currently acts as an important technical support zone, from which a bullish reaction and short-term rebound remain possible.
If this support fails to hold, downside risk extends toward the 50-month EMA near $205, followed by the golden ratio support around $170, which represents a major structural level.
As long as SNOW remains above the $170 golden ratio, the broader medium- to long-term bullish structure remains intact, and the correction can still be interpreted as a healthy retracement within an emerging uptrend rather than a trend reversal.

Snowflake (SNOW) Forms Golden Crossover on the Weekly Chart
On the weekly timeframe, Snowflake’s exponential moving averages (EMAs) have completed a golden crossover, confirming a bullish mid-term trend. This crossover strengthens the broader bullish bias and suggests improving structural momentum.
However, momentum indicators present a more nuanced picture. The RSI remains neutral, indicating neither overbought nor oversold conditions. At the same time, the MACD lines are bearishly crossed, and the MACD histogram continues to trend lower, reflecting short-term bearish momentum within the broader bullish structure.
Despite this, price action remains constructive. Last week, SNOW bounced bullishly from the 0.382 Fibonacci retracement level at $214, validating this area as key technical support. Early price action suggests that the stock is attempting to resume its upward move this week, aligning with the prevailing mid-term bullish trend established by the EMA crossover.
As long as SNOW continues to defend this support zone, the technical outlook remains cautiously bullish despite the mixed momentum signals.

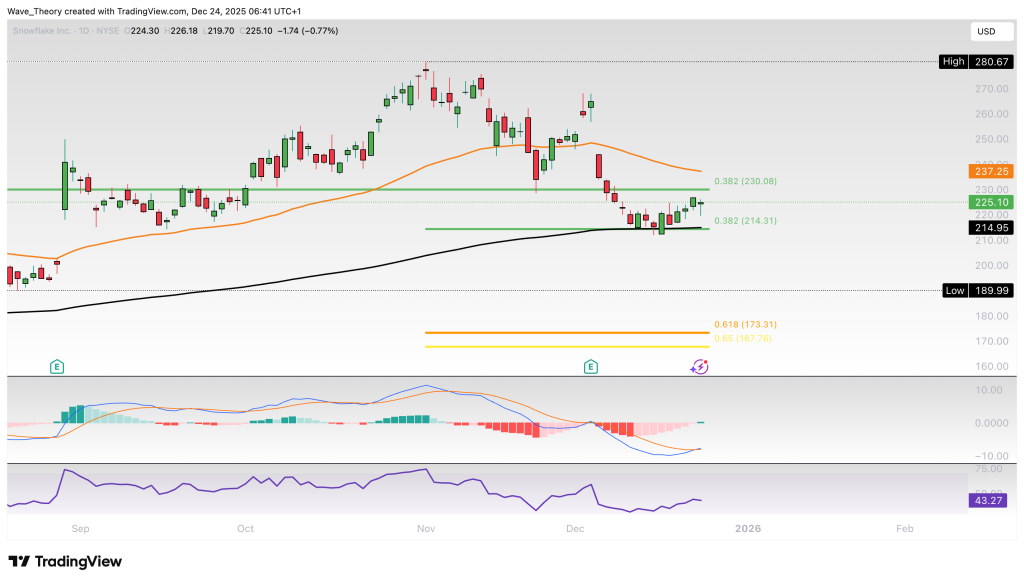
Bullish Signals on the Daily Chart
On the daily chart, momentum is beginning to turn constructive. The EMAs are on the verge of crossing bullishly, and a golden crossover has already formed, confirming a bullish trend in the short- to medium-term. At the same time, the MACD histogram is trending strongly upward, indicating increasing bullish momentum.
Meanwhile, the RSI remains in neutral territory, providing no clear directional signal at this stage.
If SNOW continues its upward move, it will encounter significant resistance at the 50-day EMA near $237.5, which represents the next key level to watch on the upside.
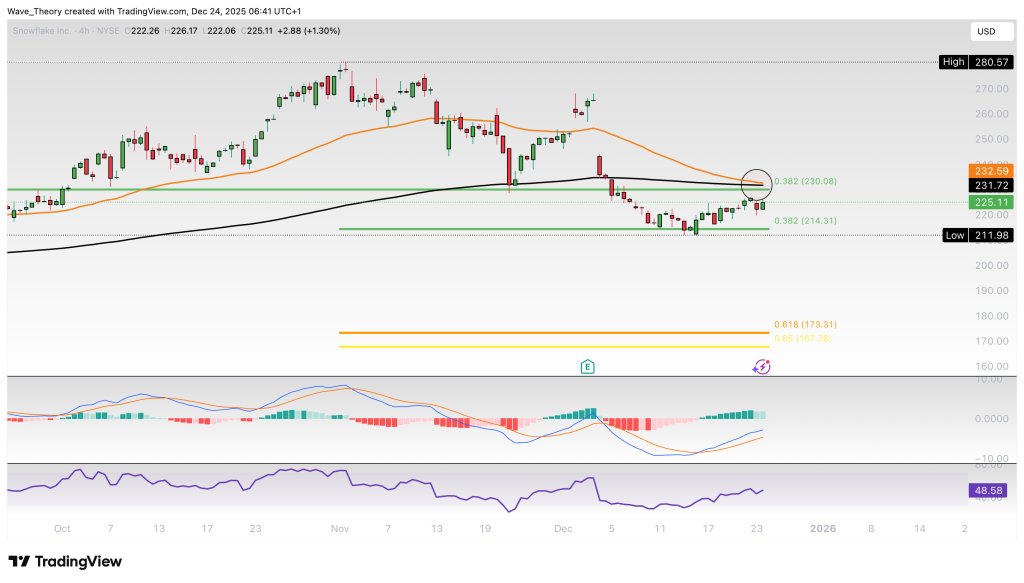
Death Cross Looming on the 4H Chart
On the 4-hour timeframe, the MACD lines are bullishly crossed, although the MACD histogram is ticking lower, indicating waning short-term momentum. The RSI continues to trade in neutral territory, offering no clear directional bias.
Importantly, the EMAs on this timeframe are at risk of forming a death cross, which would confirm a bearish short-term trend and could lead to additional consolidation or downside pressure before the next directional move.
Summary – Snowflake (SNOW) Technical Outlook
Snowflake remains technically constructive despite a sharp correction. After a 162% rally, the stock pulled back ~25% and is currently holding the 0.382 Fibonacci support at $214, which has already triggered a short-term bullish reaction.
- Key Supports:
- $214 (0.382 Fib, short-term pivot)
- $205 (50-month EMA)
- $170 (golden ratio Fib – critical level to maintain the broader bullish structure)
- Key Resistances:
- $237.5 (50-day EMA)
- $310 (golden ratio resistance needed to fully end the long-term bear trend)
- Trend Signals:
- Weekly: Golden crossover confirms a bullish mid-term trend, despite weakening momentum (bearish MACD, neutral RSI).
- Daily: Bullish momentum building with a golden crossover and rising MACD histogram.
- 4H: Short-term uncertainty, with a potential death cross forming, suggesting temporary downside or consolidation risk.
Bottom line: As long as SNOW holds above $170, the larger bullish structure remains intact. A sustained move above $237.5 would strengthen the bullish case, while a breakout above $310 would mark a decisive long-term trend reversal.
- Check out our free forex signals
- Follow the top economic events on FX Leaders economic calendar
- Trade better, discover more Forex Trading Strategies
- Open a FREE Trading Account
- Read our latest reviews on: Avatrade, Exness, HFM and XM
Related Articles
Sidebar rates
