OVID stock has surged over 728% since April, breaking above key resistance levels and reigniting speculative momentum.
Despite the recent rally, the broader long-term trend remains bearish, with critical support at the 50-week EMA of $1.18.
Technical indicators show predominantly bullish signals on the daily and 4H charts, while the weekly trend is improving but still bearish.
Key resistance levels to watch include $2.20, $3.75, and $6.20, with support levels at $1.31, $1.18, and $0.90.
Every few years, OVID stock embarks on a parabolic surge—yet the broader long-term trend remains firmly bearish. After establishing a temporary bottom in April, the stock has since exploded by roughly 730%, decisively breaking above key resistance levels and reigniting speculative momentum. This sharp rally raises critical questions about sustainability versus another corrective phase within the larger downtrend.
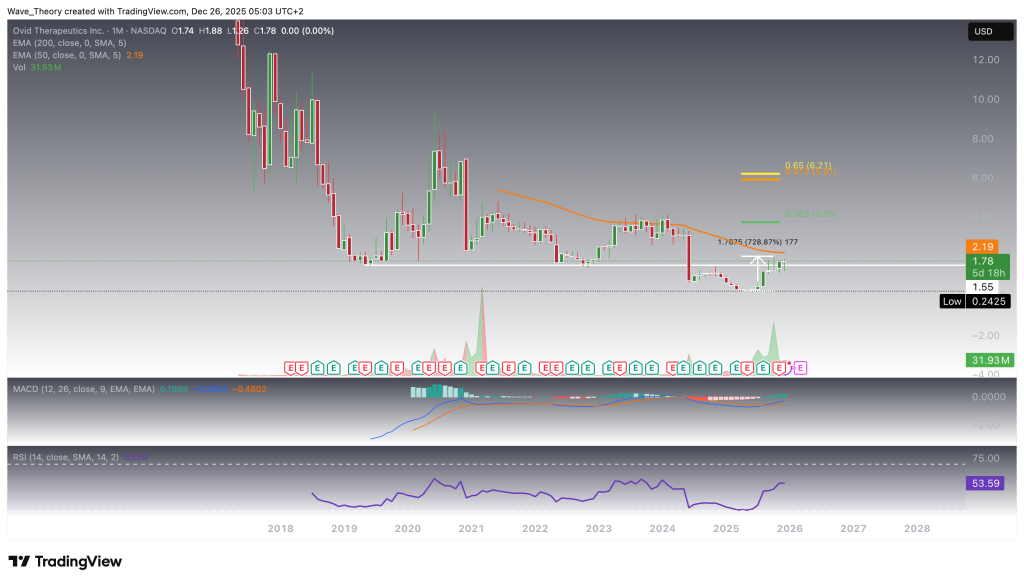
Will OVID Stock Extend Its Rally Toward the 50-Month EMA?
OVID stock has staged an extraordinary recovery, surging by more than 728% since April. In the process, it has bullishly broken above the long-standing horizontal resistance at $1.55, a level that had acted as major support for nearly six years before being lost bearishly in June 2024.
This reclaim of the $1.55 level marks a technically significant shift in market structure. As a result, OVID now has room to extend its advance by a further ~23%, targeting the 50-month EMA at approximately $2.20, which represents the next key resistance in the higher-timeframe trend.
Should OVID manage to decisively break above the 50-month EMA, the technical upside would open toward the next major Fibonacci resistance levels at $3.75 and $6.20, which would serve as the primary upside targets in an extended bullish scenario.
From a momentum perspective, the setup remains constructive. The MACD lines are bullishly crossed, and the MACD histogram continues to trend higher, signaling sustained bullish momentum. Meanwhile, the RSI remains in neutral territory, indicating that price is advancing without entering overbought conditions—leaving room for further upside.
Overall, while OVID remains in a broader long-term downtrend context, the recent price action represents a powerful counter-trend rally with clearly defined upside levels as long as key supports remain intact.
OVID
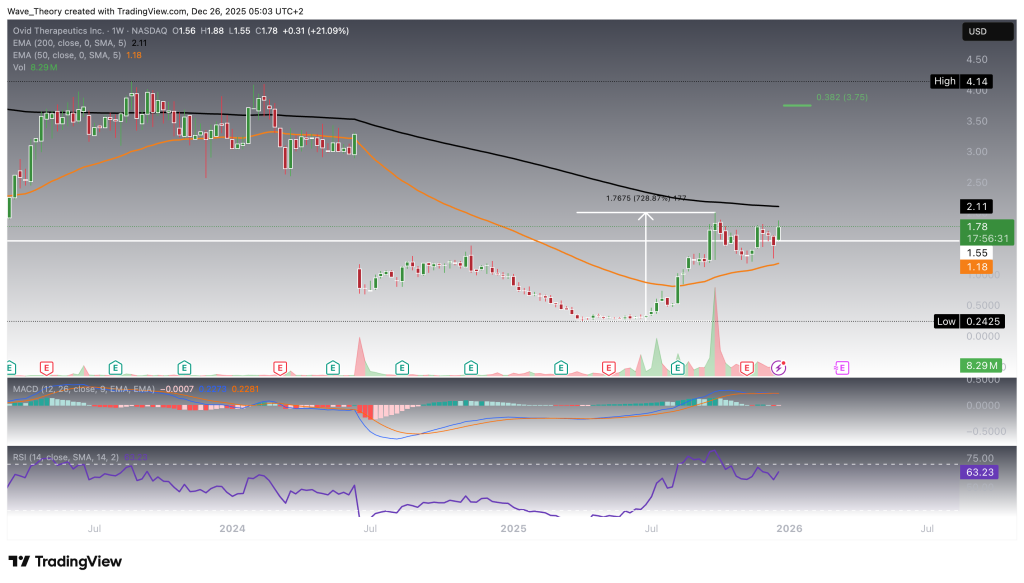
Will OVID Stock Hold Above the 50-Week EMA?
On the weekly chart, OVID presents a mixed but improving technical picture. The RSI remains neutral, indicating neither overbought nor oversold conditions, while the MACD lines are bullishly crossed, signaling positive momentum. However, the MACD histogram alternates between bullish and bearish ticks, reflecting ongoing indecision in momentum.
Despite these improving momentum signals, the EMAs are still locked in a death cross, confirming that the mid-term trend remains bearish.
From a price-action perspective, the 50-week EMA at $1.18 is a critical level to monitor. As long as OVID holds above this support, the stock maintains the potential to extend its recovery rally toward the 200-week EMA at $2.11. A decisive breakout above this level would significantly strengthen the bullish case and could open the door for a continuation move toward the 0.382 Fibonacci resistance at $3.75.
In summary, while the broader trend remains bearish on a weekly basis, holding above $1.18 keeps the upside scenario alive, with $2.11 and $3.75 acting as the next major technical milestones.
OVID
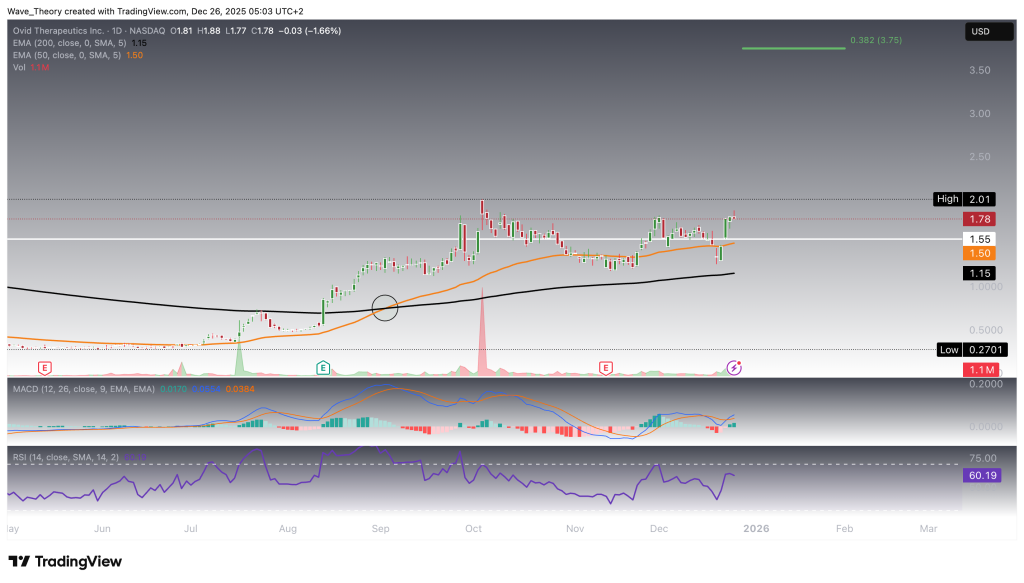
Golden Crossover Emerges on the Daily Chart
On the daily chart, OVID presents a clearly bullish technical setup. The EMAs have formed a golden crossover, confirming the trend bullishly in the short- to medium term. In addition, the MACD lines are bullishly crossed, and the MACD histogram continues to trend higher, reinforcing bullish momentum. Meanwhile, the RSI remains in neutral territory, indicating that the rally is not yet overheated and leaving room for further upside.
OVID
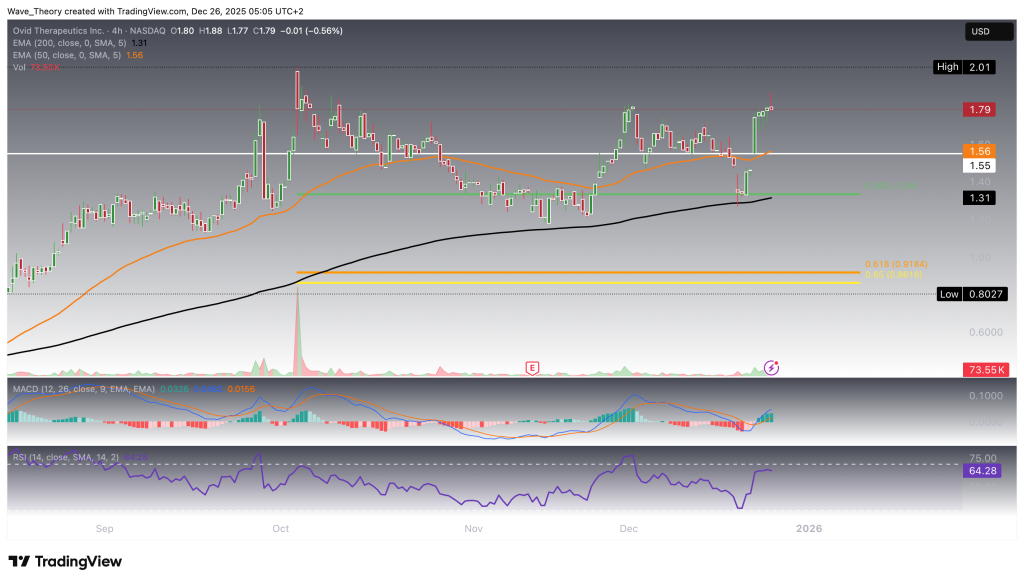
Predominantly Bullish Signals on the 4H Chart
On the 4H chart, OVID displays a largely bullish technical setup. The EMAs have formed a golden crossover, confirming a bullish trend in the short term. In addition, the MACD lines are bullishly crossed, while the MACD histogram continues to tick higher, reinforcing bullish momentum. Meanwhile, the RSI remains in neutral territory, offering no overbought or oversold signals.
Price action recently bounced bullishly off the 200-4H-EMA at $1.31, where the 0.382 Fibonacci retracement level coincides as a key support zone. As long as this support holds, the short-term structure remains constructive. However, if this level fails, the next significant support lies at the golden ratio (0.618 Fib) around $0.90, where the stock could once again find a bullish reaction.
OVID
Summary & Key Levels – OVID Technical Outlook
OVID has staged a powerful rebound, surging over 728% since April, and is now displaying predominantly bullish signals across the daily and 4H timeframes, while the weekly trend remains structurally bearish but improving.
Monthly / Macro:
OVID has decisively broken the long-term horizontal resistance at $1.55, opening the door for a move toward the 50-month EMA at $2.20. A confirmed breakout above this level would expose higher Fibonacci resistance targets at $3.75 (0.382 Fib) and $6.20.
Weekly:
Momentum indicators are constructive, with bullishly crossed MACD lines and a neutral RSI, but the EMA death cross still confirms a bearish mid-term trend. As long as OVID holds above the 50-week EMA at $1.18, upside potential remains toward the 200-week EMA at $2.11, followed by $3.75 on further strength.
Daily:
The technical structure is clearly bullish. A golden crossover on the EMAs, bullish MACD alignment, and neutral RSI confirm a short- to medium-term uptrend.
4H:
The short-term trend remains bullish, supported by a golden EMA crossover and strengthening MACD momentum. OVID recently bounced from the 200-4H EMA and 0.382 Fib support at $1.31. If this level fails, the next major support lies at the golden ratio near $0.90.
Key Levels to Watch:
Supports: $1.31 → $1.18 → $0.90
Resistances: $2.11 → $2.20 → $3.75 → $6.20
Overall, momentum favors further upside in the short term, while a sustained move above $2.20 would significantly strengthen the broader bullish case.
Konstantin Kaiser comes from a data science background and has significant experience in quantitative trading. His interest in technology took a notable turn in 2013 when he discovered Bitcoin and was instantly intrigued by the potential of this disruptive technology.