After Gold and Silver Surge: Is Palladium Next?

Quick overview
- Palladium has rallied over 134% since August 2024, approaching critical resistance at $1,928.
- A breakout above $1,928 could lead to further gains towards $2,525, confirming a bullish trend.
- The $1,525 level serves as key support, with a bearish break below it shifting focus to $1,250.
- Momentum indicators remain mixed but generally constructive, supporting a bullish outlook in the short- to medium term.
Palladium has staged an impressive recovery since April last year, rallying by more than 119% in a relatively short period. While gold and silver have surged aggressively in recent months, palladium now appears to be catching up, showing renewed relative strength. The key question remains: can palladium extend this momentum and reclaim its 2022 highs?
Palladium Up 134% Since August 2024
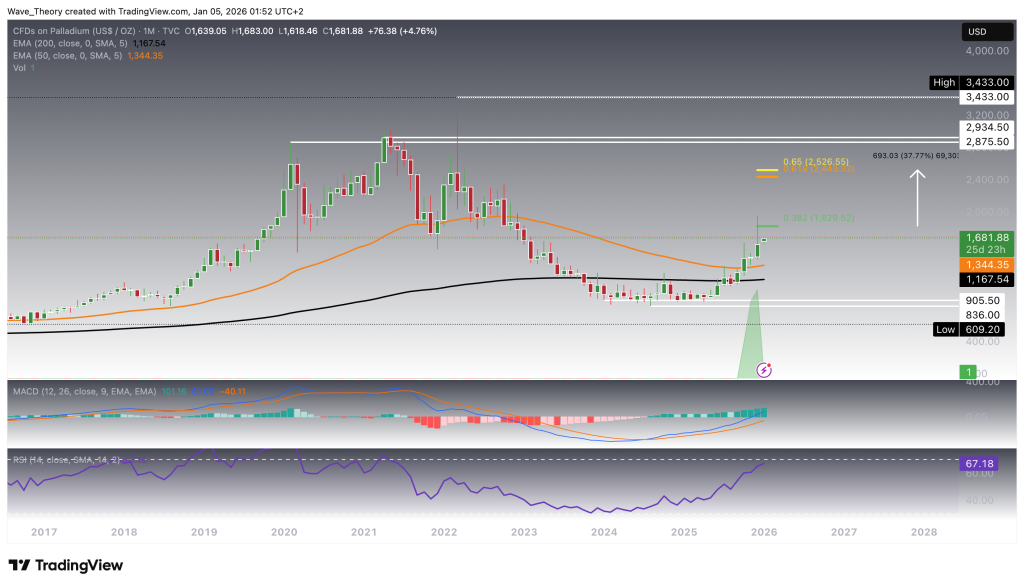
Palladium has rallied by approximately 134% since August 2024, bringing price into a technically critical zone. The advance has carried price directly into the 0.382 Fibonacci resistance at $1,928, where it is currently encountering notable resistance and struggling to achieve a decisive breakout.
Should palladium successfully break and hold above the $1,928 level, the technical structure opens the door for a further upside extension of roughly 38%, with the next major target located at the golden ratio resistance at $2,525. A confirmed breakout above $2,525 would invalidate the broader corrective phase and formally reestablish palladium in a bullish trend regime.
From a higher-timeframe perspective, momentum indicators continue to support the bullish case. On the monthly chart, the exponential moving averages remain in a golden crossover configuration, confirming a structurally bullish long-term trend. In addition, the MACD lines are bullishly crossed, while the MACD histogram continues to trend higher, signaling sustained positive momentum. Meanwhile, the RSI is positioned in neutral territory, indicating that the market is not yet overheated and retains room for further upside.
In summary, palladium remains technically constructive, with $1,928 acting as the pivotal resistance. A breakout above this level would significantly improve the probability of a continuation toward $2,525, where the long-term trend direction will ultimately be decided.
Golden Crossover Approaching on Palladium’s Weekly Chart
On the weekly timeframe, palladium is on the verge of printing a golden crossover of the exponential moving averages, which would bullishly confirm the mid-term trend structure if validated.
That said, momentum has softened slightly in the very near term. The MACD histogram has been ticking bearishly lower since last week, indicating a short-term deceleration in upside momentum, even though the MACD lines themselves remain bullishly crossed, keeping the broader momentum structure intact. At the same time, the RSI has retreated into neutral territory after briefly reaching overbought conditions last week, suggesting a healthy consolidation rather than a trend reversal.
From a price-action perspective, the weekly chart clearly shows strong rejection at the 0.382 Fibonacci resistance located at $1,829, highlighting this level as a key technical barrier that must be overcome to unlock further upside.
In summary, while palladium is experiencing short-term consolidation and momentum cooling, the approaching EMA golden crossover keeps the mid-term outlook constructive, provided price can eventually reclaim and sustain above the $1,829 resistance zone.

Palladium Rebounds Bullishly From 0.382 Fibonacci Support
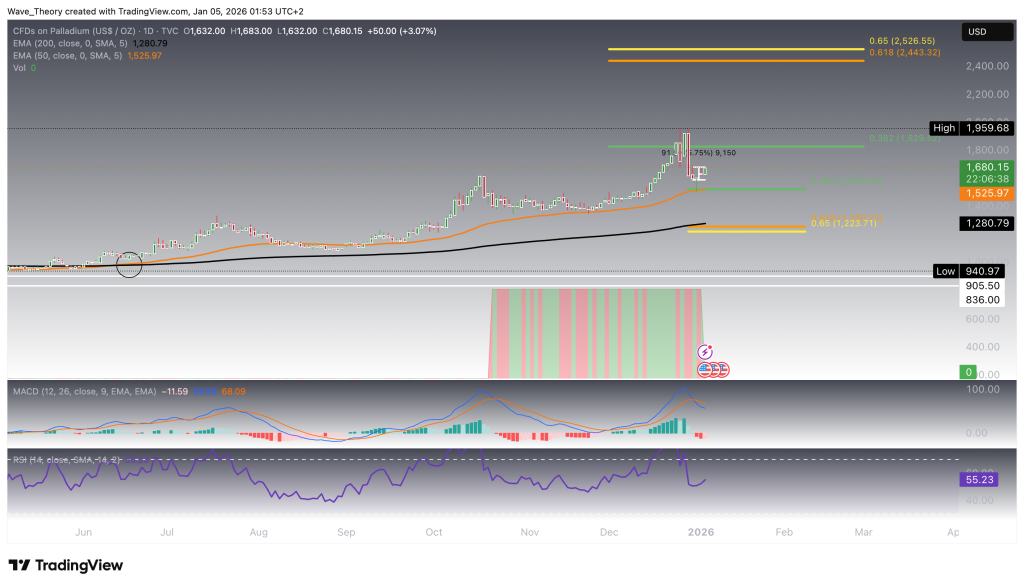
Palladium retraced precisely to the 0.382 Fibonacci support at $1,525, where it found confluent support at the 50-day EMA, reinforcing this level as a technically significant demand zone. From there, price reacted bullishly, already advancing by approximately 6%, signaling renewed buying interest.
If palladium sustains this recovery, the next upside objective lies at the 0.382 Fibonacci resistance at $1,829, which previously acted as a rejection zone and therefore remains a key level to monitor. Conversely, should palladium break below the $1,525 support on a bearish continuation, the next major Fibonacci support emerges at the golden ratio level around $1,250, where the 200-day EMA provides additional structural support.
From a momentum perspective, the daily chart presents a mixed technical picture. The exponential moving averages remain in a golden crossover, confirming a bullish short- to medium-term trend structure. However, the MACD lines have crossed bearishly, signaling short-term corrective pressure, even as the MACD histogram has begun to tick bullishly higher today, hinting at a potential momentum stabilization. Meanwhile, the RSI is positioned in neutral territory, offering neither bullish nor bearish directional confirmation.
Overall, palladium’s ability to defend the $1,525 Fibonacci support remains pivotal. Holding above this level keeps the bullish recovery scenario toward $1,829 intact, while a breakdown would shift focus toward $1,250 as the next critical downside level.
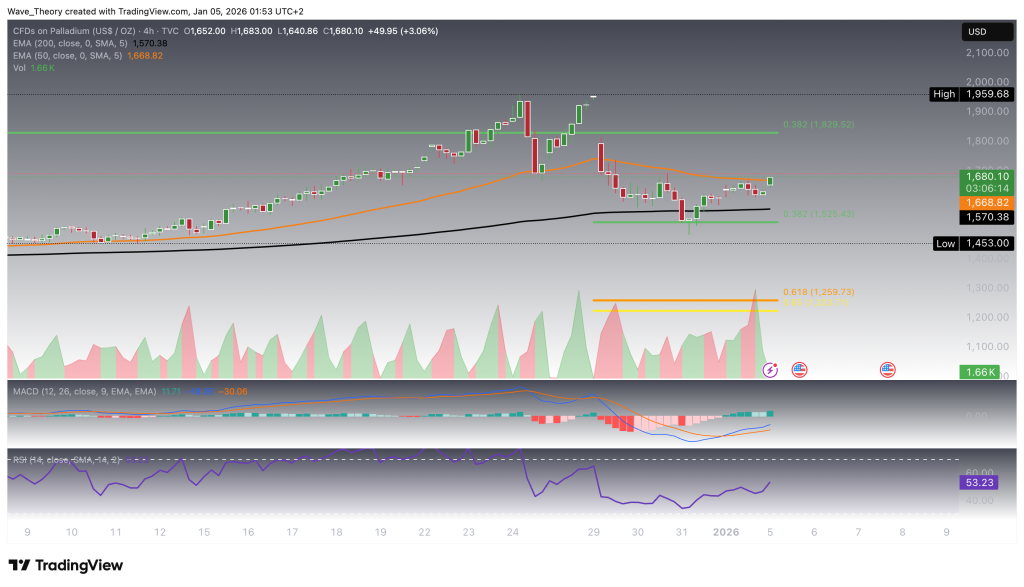
Predominantly Bullish Outlook on Palladium’s 4H Chart
On the 4-hour timeframe, palladium is currently attempting to break above the 50-period EMA resistance, located around $1,669. A decisive bullish breakout above this level would likely open the door for a continuation move toward the 0.382 Fibonacci resistance, and potentially beyond, as bullish momentum accelerates.
From an indicator perspective, the technical structure remains supportive. Both the exponential moving averages and the MACD lines are bullishly crossed, confirming a bullish short-term trend. In addition, the MACD histogram is currently ticking bullishly higher, signaling strengthening upside momentum. Meanwhile, the RSI remains in neutral territory, suggesting there is still room for further upside without immediate overheating risks.
Overall, the 4H chart points to a predominantly bullish setup, with momentum and trend indicators aligned in favor of higher prices in the short- to medium-term, provided palladium can successfully reclaim and hold above the $1,669 EMA resistance.
Palladium — Short Summary & Key Levels
Palladium remains structurally bullish across multiple timeframes, supported by a strong rebound from key Fibonacci support and broadly constructive momentum signals. The $1,525 level (0.382 Fib + 50-day EMA) has acted as a pivotal support, from which price has already bounced ~6%, keeping the bullish recovery scenario intact.
In the short term (4H), palladium is attempting to reclaim the 50-EMA at $1,669. A confirmed breakout above this level would likely trigger a continuation toward $1,829 (0.382 Fib resistance), with further upside potential toward $1,928 and ultimately the golden ratio at $2,525, where a full trend reversal into a macro bull market would be confirmed.
Downside risk remains limited as long as palladium holds above $1,525. A bearish break below this level would shift focus to the golden ratio support at $1,250, reinforced by the 200-day EMA.
Momentum indicators are mixed but constructive: EMAs remain in golden crossovers on the daily and monthly charts, MACD momentum is stabilizing after a brief cooldown, and the RSI is neutral, leaving room for further upside.
Key Levels
- Immediate Resistance: $1,669 → $1,829
- Major Resistance: $1,928 → $2,525 (golden ratio)
- Key Support: $1,525 (0.382 Fib + 50-day EMA)
- Major Support: $1,250 (golden ratio + 200-day EMA)
Overall Bias: Bullish in the short- to medium term, constructive long-term outlook as long as $1,525 holds.
- Check out our free forex signals
- Follow the top economic events on FX Leaders economic calendar
- Trade better, discover more Forex Trading Strategies
- Open a FREE Trading Account
- Read our latest reviews on: Avatrade, Exness, HFM and XM