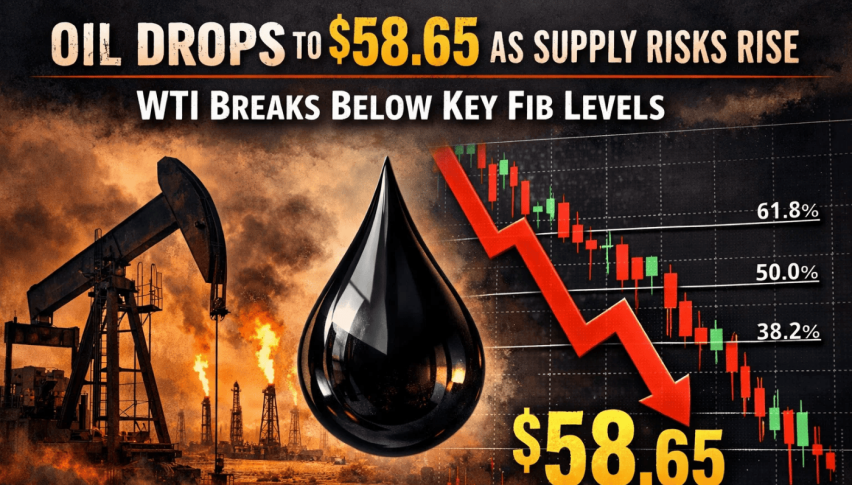
Oil Drops to $58.65 as Supply Risks Rise and WTI Breaks Below Key Fib Levels
Oil prices are trading lower as geopolitical tensions keep supply concerns elevated. Brent crude is down 0.3% at $63.15...
Quick overview
- Oil prices are declining due to ongoing geopolitical tensions, with Brent crude at $63.15 and WTI near $58.65.
- Analysts highlight significant supply risks from Iran's production amidst intensifying protests and potential U.S. sanctions.
- Traders are cautious as they await clear evidence of supply disruptions, particularly in light of recent strikes on Russian energy infrastructure.
- Technical analysis indicates WTI is under downside pressure, with critical support levels at $58.28 and $57.33.
Oil prices are trading lower as geopolitical tensions keep supply concerns elevated. Brent crude is down 0.3% at $63.15, while WTI trades near $58.65, pressured by renewed uncertainty around Iran and Venezuela. Analysts warn that Iran’s 3.2 million barrels per day of production leaves meaningful supply risk on the table as protests intensify.
The White House is set to review possible responses to Iran, including sanctions and cyber actions. At the same time, investors are monitoring the risk of further disruptions in Russia following strikes on energy infrastructure in the region. These developments have added a layer of caution to an already fragile market.
Geopolitics Keep Market on Edge
Tensions remain a key driver. Traders are pricing in the possibility of new U.S. sanctions and defense actions, while European military repositioning in Greenland is adding to broader uncertainty. Despite these risks, the market’s reaction remains limited, suggesting traders are waiting for clear evidence of disrupted supply flows.
WTI Technical Analysis: Downside Pressure Builds
WTI crude is pulling back after failing to hold above the $59.80 resistance area. Candlestick rejection along the descending trendline shows sellers defending this zone. Price is now testing the 23.6% Fibonacci retracement at $58.86, with the 38.2% level at $58.28 acting as the next support.
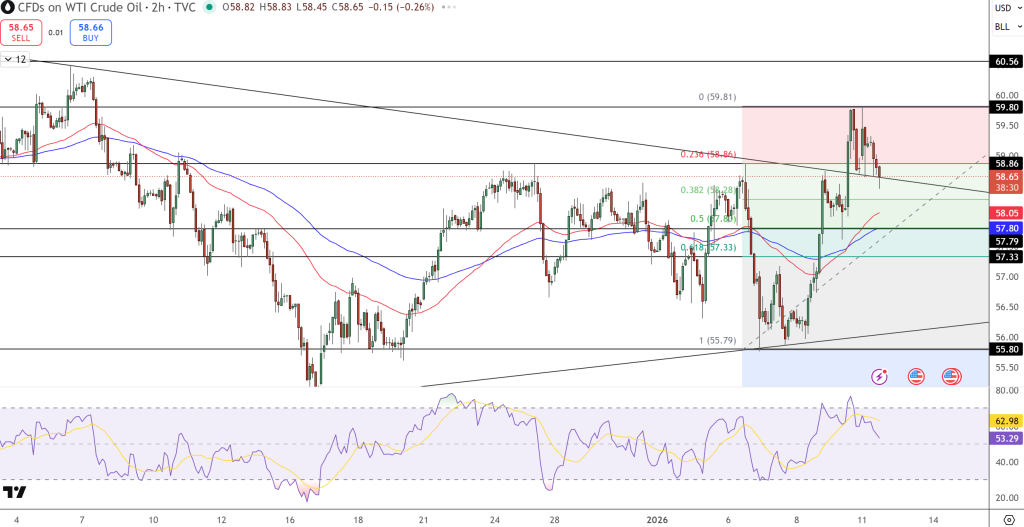
A break below $58.28 opens the door to the 50% Fib at $57.80 and the 61.8% level at $57.33, aligning with a short-term rising trendline. The 50-EMA and 200-EMA remain close together, indicating a neutral short-term structure. RSI hovering near 53 shows fading momentum after pulling back from overbought conditions.
If price stays below the descending channel’s upper boundary, further downside is likely. Holding above $58.28, however, could attract dip buyers looking for a rebound from Fib support.
Trade Idea: Sell below $58.28, targeting $57.33.
- Check out our free forex signals
- Follow the top economic events on FX Leaders economic calendar
- Trade better, discover more Forex Trading Strategies
- Open a FREE Trading Account
- Read our latest reviews on: Avatrade, Exness, HFM and XM