ASML Holding Stock Doubles in Six Months as AI Chip Demand Soars
Quick overview
- ASML Holding's stock has surged approximately 138% over the past ten months, driven by strong demand for AI-optimized semiconductors.
- The stock recently tested the 50-month EMA support at $663, historically a critical level for rebounds, suggesting a potential buying opportunity.
- Currently trading at all-time highs near $1,375, ASML faces no horizontal resistance, with the next Fibonacci projection at $1,438 serving as a potential take-profit zone.
- Despite some short-term downside risks indicated by bearish divergence on the 4-hour chart, the overall trend remains bullish supported by strong technical and fundamental factors.
ASML Holding has delivered impressive performance recently, with its stock rising approximately 138% over the past ten months and about 107% in the last six months. As demand for AI-optimized semiconductors continues to surge and advanced lithography remains essential for next-generation nodes, the market is asking: where is ASML’s stock price headed next?
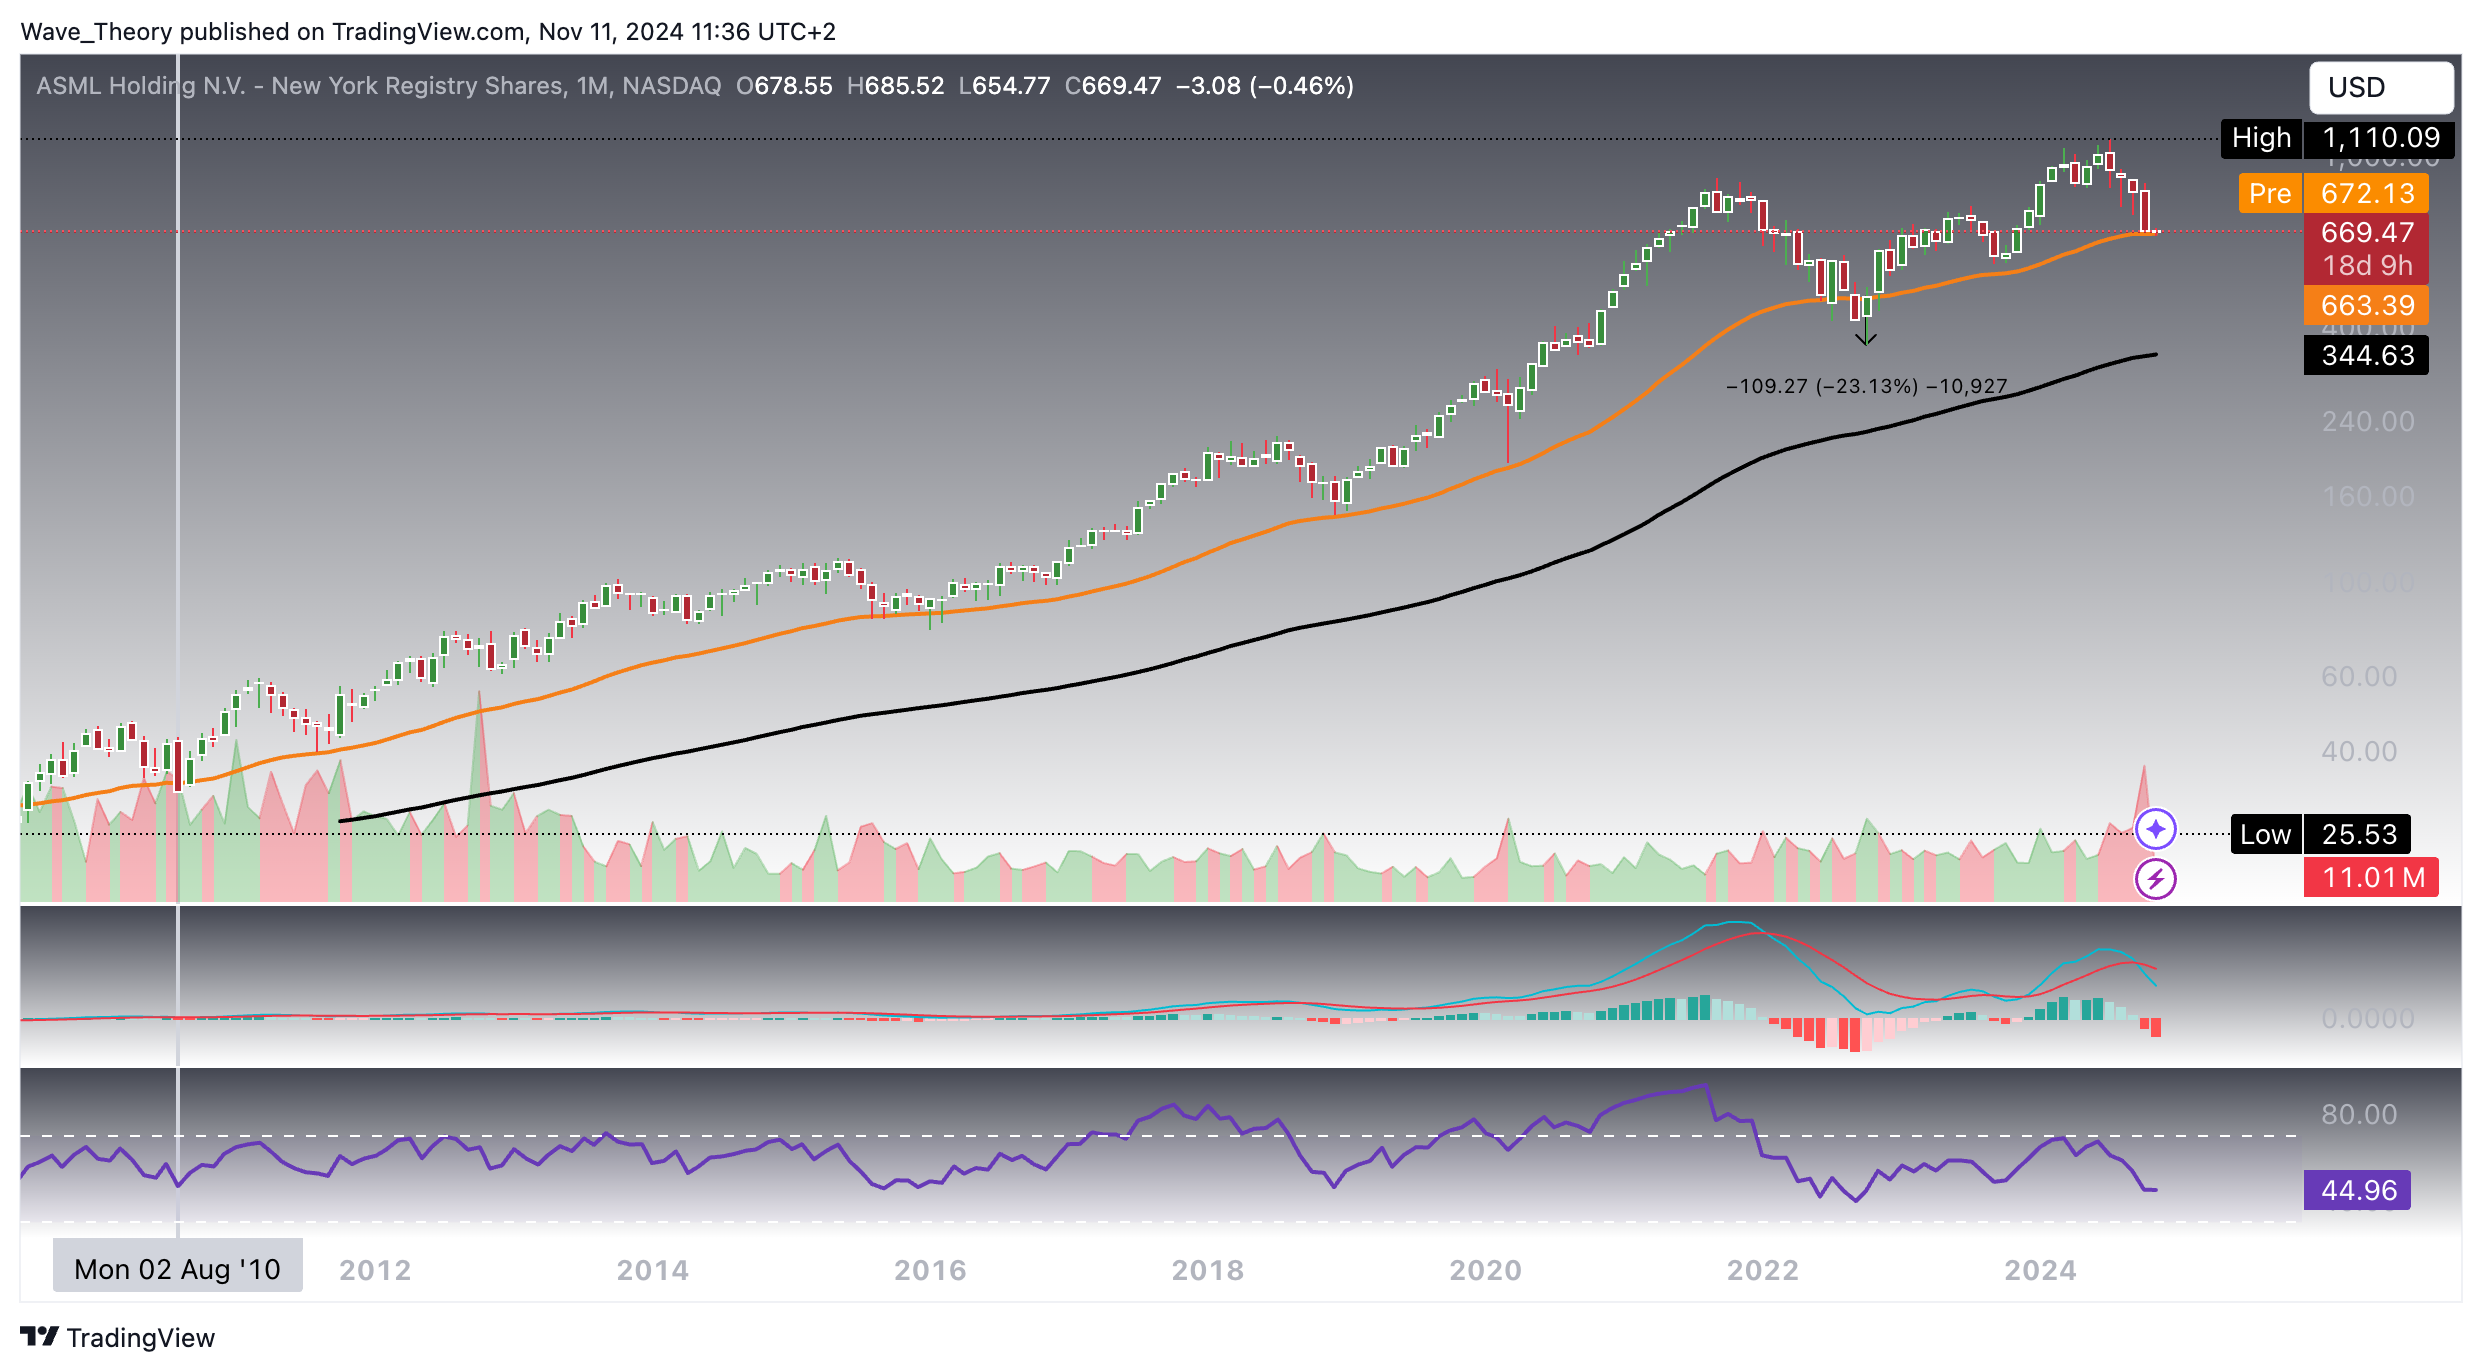
On November 11 2024, ASML stock price reached the 50-month-EMA support. I wrote:
“ASML Holding Hits Historical Support Level: A Critical Turning Point for Stock Performance
ASML Holding’s stock has historically exhibited strong resilience around its 50-month EMA, returning to this support level seven times in the past 14 years. Each time, the stock rebounded sharply, continuing its parabolic uptrend, with one exception in 2022, when ASML briefly dipped below the 50-month EMA by 23%. However, it quickly recovered and went on to set a new all-time high at $1,110.
This pattern suggests that ASML’s current return to the 50-month EMA at $663 could present an attractive buying opportunity, especially considering the bullish market sentiment with President Trump back in office. Historically, rebounds from this level have led to significant price appreciation.”
ASML Stock More Than Doubles After Bouncing Off the 50-Month EMA at $663
When ASML Holding’s stock price initially reached the 50-month EMA at $663, it triggered a short-term rally of roughly 20%, before retracing back toward the same level. Within that same month, after revisiting the 50-month EMA again, ASML briefly broke below the support by approximately 13%, only to reverse sharply and surge by about 43%, before once again pulling back toward the 50-month EMA in August 2025.
As a result, between November 2024 and August 2025, ASML tested the 50-month EMA support three separate times, producing only modest upside of up to 43% while also allowing for additional downside of roughly 13%. This prolonged consolidation phase at long-term support ultimately laid the foundation for a decisive breakout.
From August 2025 onward, ASML entered a powerful acceleration phase, surging by approximately 107%. Notably, in the current month alone, the stock has already advanced by roughly 21%, highlighting the strength and momentum of the ongoing move.
From a trend perspective, the exponential moving averages have formed a golden crossover, confirming the long-term trend bullishly. Momentum indicators further support this view, with the MACD lines bullishly crossed and the MACD histogram ticking higher for multiple consecutive months. Meanwhile, the RSI is gradually approaching overbought territory, reflecting strong upside momentum without yet flashing a clear exhaustion signal.
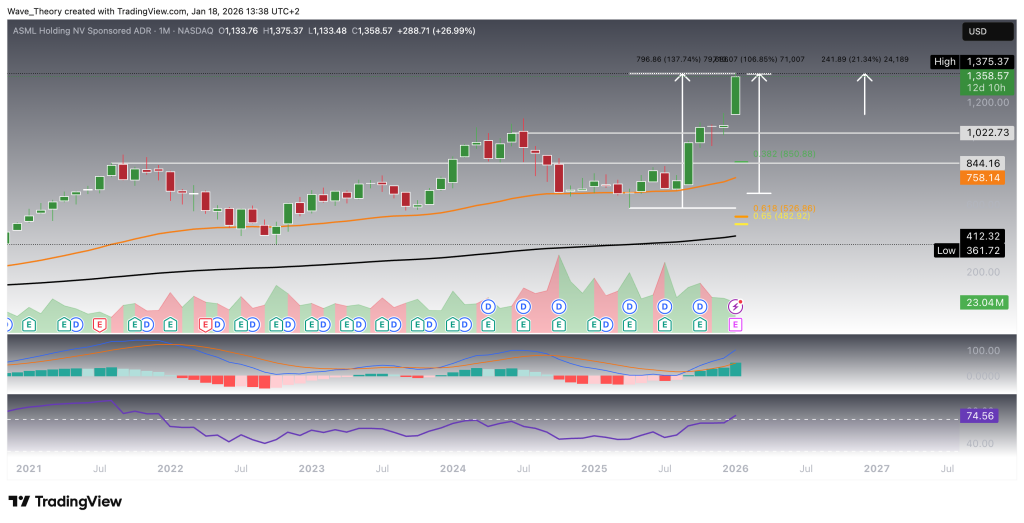
ASML Holding
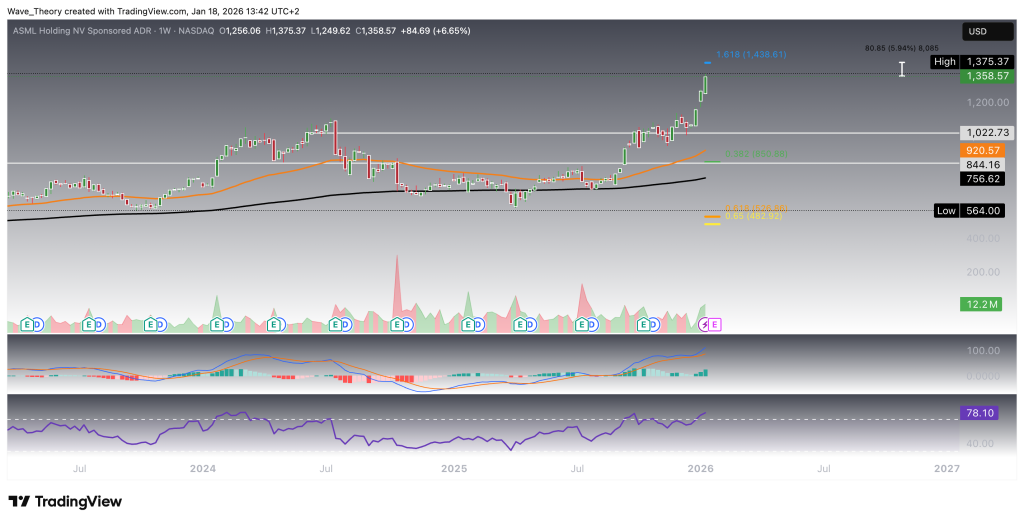
No Clear Resistance in Sight — Fibonacci Projection May Offer a Short-Term Exit
On the weekly chart, both the exponential moving averages and the MACD lines are bullishly crossed, confirming the trend bullishly in the mid-term. In addition, the MACD histogram has been ticking higher for the past three weeks, indicating strengthening upside momentum. Meanwhile, the RSI continues to trade in overbought territory, yet without producing any bearish divergence or sell signals.
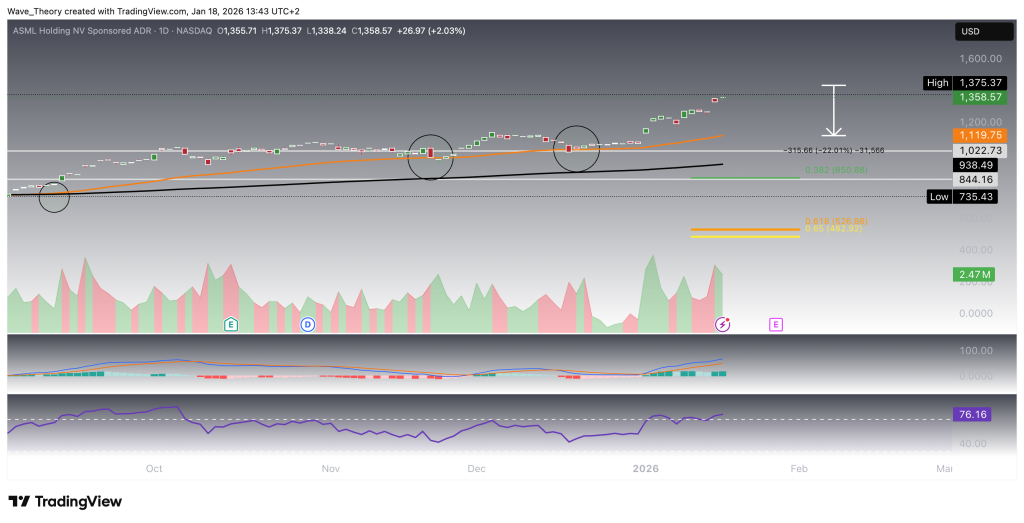
With ASML Holding having printed a new all-time high at $1,375, there are currently no horizontal resistance levels overhead. As a result, Fibonacci extensions become the primary reference points. The 1.618 Fibonacci projection level at $1,438, approximately 6% above current price levels, may act as a potential short-term take-profit zone and could precede a corrective move.
In the event of a steeper correction, ASML would find its next Fibonacci support levels at approximately $850 and $500, with an additional broader support zone located between $844 and $1,022, which could provide structural backing on pullbacks.
ASML Holding Consistently Respects the 50-Day EMA Throughout the Uptrend
During the ongoing uptrend over the past three months, ASML Holding’s stock price has repeatedly retraced to the 50-day EMA, where it found support and subsequently bounced higher to resume its advance. This behavior highlights the 50-day EMA as a key dynamic support level within the current trend structure.
Should ASML face rejection at the Fibonacci projection level located roughly 6% above current price levels, the stock could enter a corrective phase, with a pullback toward the 50-day EMA implying potential downside of approximately 22%. Despite this risk, momentum indicators on the daily chart remain clearly bullish.
The exponential moving averages continue to display a golden crossover, confirming the short-term trend bullishly. In addition, the MACD lines are bullishly crossed, while the MACD histogram has begun ticking higher again since yesterday, signaling a renewed pickup in momentum. At the same time, the RSI remains in overbought territory; however, the previously emerging risk of a bearish divergence has already been invalidated.
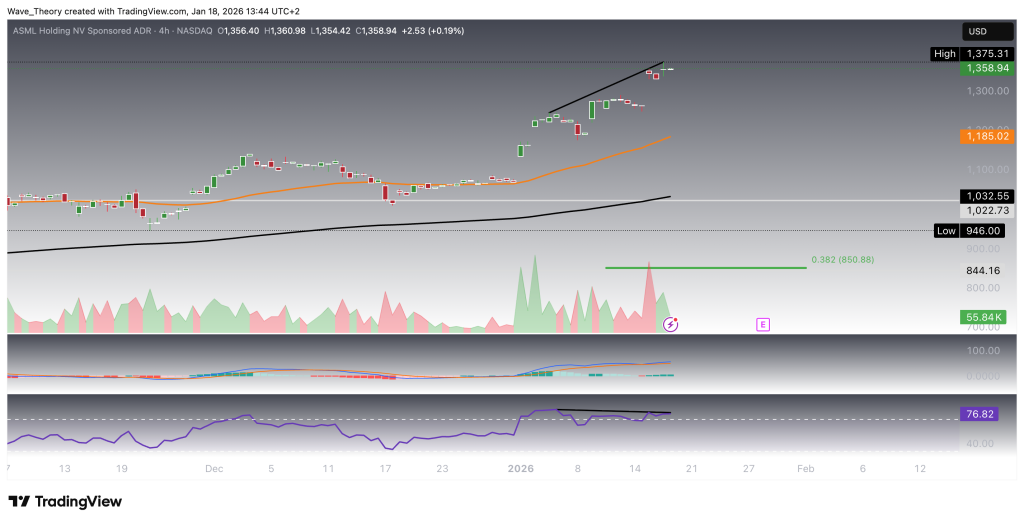
Bearish Divergence Emerges on the 4H Chart
On the 4-hour chart, the RSI is displaying a bearish divergence, which could amplify the risk of a short-term corrective move. That said, momentum indicators remain largely supportive of the prevailing trend. The MACD remains clearly bullish, with the MACD lines bullishly crossed and the MACD histogram printing positive bars.
In addition, the exponential moving averages continue to display a golden crossover, confirming the trend bullishly in the short term. Overall, ASML’s structure remains decisively bullish, despite the presence of some near-term downside risk driven by short-term momentum divergence.
ASML Technical & Fundamental Summary — Key Levels in Focus
ASML Holding remains structurally bullish across all higher timeframes, supported by a strong technical trend and an exceptionally robust fundamental backdrop. Technically, the long-term uptrend was firmly established after ASML repeatedly defended the 50-month EMA at $663, which ultimately acted as a multi-year accumulation base before the stock more than doubled. The trend remains intact, with golden crossovers present across the monthly, weekly, and daily charts, while momentum indicators broadly confirm upside continuation despite signs of short-term exhaustion.
From a price-structure perspective, ASML is currently trading at all-time highs near $1,375, leaving no horizontal resistance overhead. The next relevant upside reference remains the 1.618 Fibonacci projection at $1,438, which may serve as a short-term take-profit zone and potential catalyst for a corrective pullback. In the event of a rejection, a retracement toward the 50-day EMA would imply downside of roughly 22%, while deeper corrections would find structural support within the $844–$1,022 zone, followed by key Fibonacci supports at $850 and $500.
Lower timeframes suggest some near-term volatility, as a bearish RSI divergence on the 4H chart points to short-term downside risk. However, both the MACD and EMAs remain bullish on intraday and daily timeframes, indicating that any pullback is currently corrective rather than trend-reversing.
Fundamentally, ASML’s technical strength is underpinned by a near-unassailable competitive position. ASML remains the sole global supplier of EUV lithography systems, a critical bottleneck technology for manufacturing advanced chips at 7 nm and below, which are essential for AI, high-performance computing, and data-center workloads. This EUV monopoly represents a structural moat that is highly unlikely to be meaningfully challenged over the next 24 months. At the same time, AI-driven semiconductor demand continues to accelerate, with industry forecasts projecting total semiconductor sales approaching or exceeding $1 trillion by 2030, directly reinforcing long-term demand for ASML’s systems.
Bottom line: ASML remains in a powerful long-term uptrend with clear bullish structure. While short-term pullbacks toward dynamic support levels are possible, the combination of technical strength and a dominant fundamental position continues to favor higher prices over the medium to long term.
- Check out our free forex signals
- Follow the top economic events on FX Leaders economic calendar
- Trade better, discover more Forex Trading Strategies
- Open a FREE Trading Account
- Read our latest reviews on: Avatrade, Exness, HFM and XM