AUD/USD Hits 0.67126 as U.S. Dollar Slips—30K Jobs Could Fuel 0.67664 Rally
During Monday’s European session, the Australian dollar climbed to 0.6708, holding firm above the 0.6700 level...
Quick overview
- The Australian dollar rose to 0.6708, supported by a weaker U.S. dollar amid escalating tensions between the U.S. and the EU.
- President Trump's proposed tariffs on European imports have faced strong backlash, contributing to the decline of the U.S. Dollar Index.
- Traders are anticipating a mixed December jobs report from Australia, which could influence the Reserve Bank of Australia's future decisions.
- AUD/USD is testing key Fibonacci levels, with potential for further gains if it closes above 0.67270 with strong volume.
During Monday’s European session, the Australian dollar climbed to 0.6708, holding firm above the 0.6700 level. The rally wasn’t just about Aussie strength, it was driven by a weaker U.S. dollar, pressured by escalating tensions between Washington and the EU.
President Donald Trump’s announcement of 10% tariffs on imports from Germany, France, the UK, and others, potentially rising to 25%, sparked backlash. The move was linked to the U.S. push to purchase Greenland, a proposal that European leaders strongly opposed.
Germany called the threats “unacceptable,” and Greenland’s Prime Minister Jens-Frederik Nielsen made it clear that U.S. pressure wouldn’t change their stance. The U.S. Dollar Index (DXY) fell 0.2% to 99.20, giving the Aussie room to rise.
Aussie Dollar Steady Before Jobs Data
Back home, traders are watching Thursday’s December jobs report, which is expected to show 30,000 new jobs added, a rebound from November’s 21,300 job loss. However, the unemployment rate may tick up to 4.4% from 4.3%, reflecting a mixed labor market.
This data could shape the Reserve Bank of Australia’s tone heading into February, especially as rate differentials between the RBA and the Fed continue to favor the Aussie.
AUD/USD Technical Setup: Fib Levels in Play
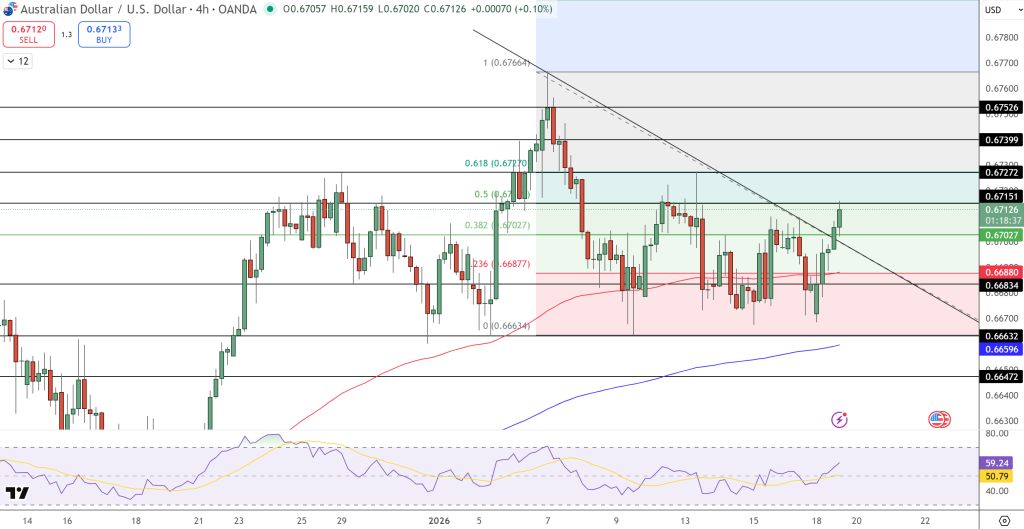
AUD/USD is trading near 0.67126, showing signs of recovery after bouncing off support at 0.66634. The pair is testing key Fibonacci retracement levels, with 0.67270 (61.8%) acting as a near-term ceiling.
- Resistance: 0.67270, 0.67399, 0.67526
- Support: 0.66634, 0.66472
- RSI: 59.24 (bullish), 50.79 (neutral)
- Fibonacci zones: 0.66877, 0.67027, 0.67100, 0.67270
Price has crossed above both moving averages, and RSI is trending higher, suggesting momentum is building.
What Traders Should Watch
If AUD/USD closes above 0.67270 with strong volume, it could rally toward 0.67664, the full Fibonacci extension.
Key signals to monitor:
- Break above 0.67270 with volume
- RSI holding above 60
- Price staying above 50- and 200-period MAs
If momentum fades, downside risk could reemerge toward 0.66834 and 0.66632, but for now, bulls remain in control.
- Check out our free forex signals
- Follow the top economic events on FX Leaders economic calendar
- Trade better, discover more Forex Trading Strategies
- Open a FREE Trading Account
- Read our latest reviews on: Avatrade, Exness, HFM and XM
Related Articles


Sidebar rates
Related Posts
