Microsoft Stock (MSFT) Pulls Back 21% After Major Rally — Is More Downside Ahead?

Quick overview
- Microsoft (MSFT) has experienced a significant decline of approximately 21% since reaching an all-time high of $555.5 in July 2025.
- The stock is currently testing critical support levels, with the golden ratio Fibonacci support at around $420 being a key downside target.
- While the long-term trend remains bullish, short-term indicators show weakening momentum, with potential bearish signals emerging on multiple timeframes.
- A sustained break above the resistance zone of $471-$487 is necessary to invalidate the current bearish bias and re-establish a bullish trend.
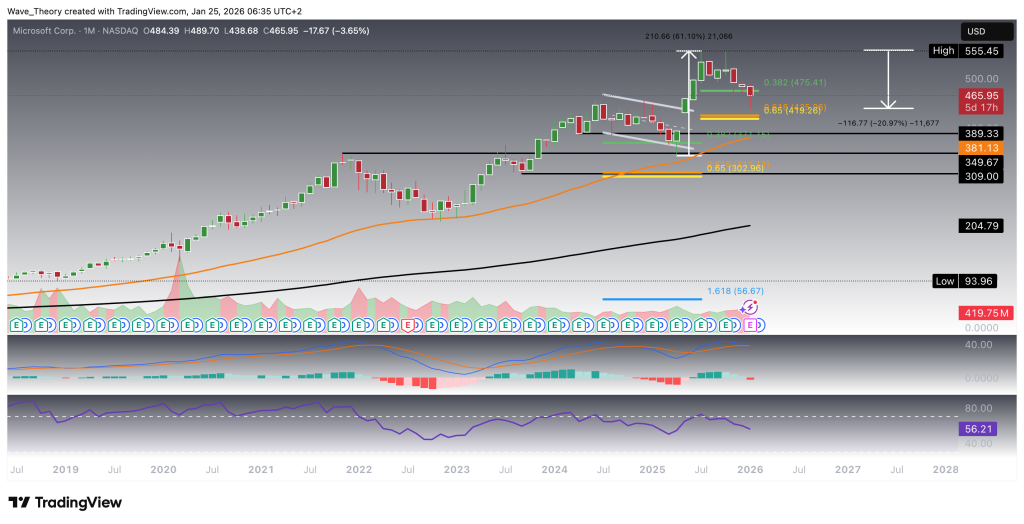
After years of strong gains across the technology sector, Microsoft (MSFT) marked a new all-time high around $555.5 in July 2025. Since then, the stock has declined roughly 21%, signaling a notable shift in short-term market momentum.
Microsoft Stock (MSFT) Could Find Support at Golden Ratio Level Near $420
Since 2024, Microsoft (MSFT) has been trending lower from its prior high near $466, declining into the 0.382 Fibonacci retracement level around $371. This level aligned closely with a historical support zone between $350 and $389, from which the stock rebounded decisively. Following this reaction, MSFT rallied for approximately four months, advancing by roughly 61% and ultimately printing a new all-time high at $555.5.
After initially correcting from that peak, the stock made another attempt at the all-time high in October 2025, but once again faced rejection. This failure marked the beginning of a pronounced correction phase, with MSFT declining by approximately 21% over the past four months.
Technically, Microsoft now appears to be breaking below the 0.382 Fibonacci support near $475, opening the door for a continuation of the downside move toward the golden ratio (0.618) support at approximately $420. While the monthly EMAs continue to display a golden crossover, signaling that the long-term trend remains structurally bullish, momentum indicators are beginning to deteriorate. The MACD lines are at risk of a bearish crossover, and the MACD histogram has been ticking lower for four consecutive months, reflecting increasing downside momentum. Meanwhile, the RSI remains neutral, offering neither bullish nor bearish confirmation at this stage.
Overall, while the long-term trend remains intact, MSFT is currently undergoing a meaningful corrective phase, with $420 emerging as a critical technical level where buyers may attempt to reassert control.
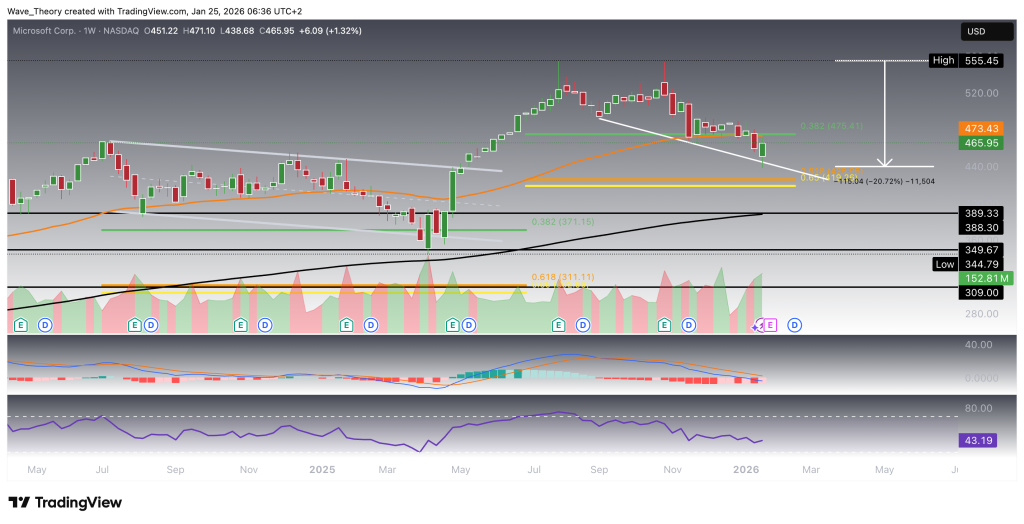
Mixed Signals on the Weekly Chart
On the weekly chart, the EMAs continue to display a golden crossover, confirming the mid-term trend as bullish. In addition, the MACD histogram has begun to tick bullishly higher this week, suggesting a potential slowdown in bearish momentum.
However, caution remains warranted. The MACD lines are still bearishly crossed, indicating that momentum has not yet fully shifted back in favor of the bulls. At the same time, the RSI remains in neutral territory, providing neither bullish nor bearish confirmation.
From a price-action perspective, Microsoft is currently holding trendline support, but failure to maintain this level could result in a continuation of the corrective move. In that scenario, the golden ratio Fibonacci support near $420 remains the next key downside target.
Should this level fail to hold, the next key support lies at the 200-week-EMA at $389.
Death Cross Could Form on the Daily Chart
On the daily chart, the EMAs are on the verge of forming a death cross, which would confirm the trend bearishly in the short- to medium-term. This development would reinforce the prevailing corrective structure.
However, momentum indicators are beginning to send early counter-signals. The MACD lines are close to crossing bullishly, while the MACD histogram has started to tick bullishly higher since yesterday, suggesting a potential short-term momentum recovery.
Meanwhile, the RSI remains in neutral territory, offering neither bullish nor bearish confirmation at this stage.
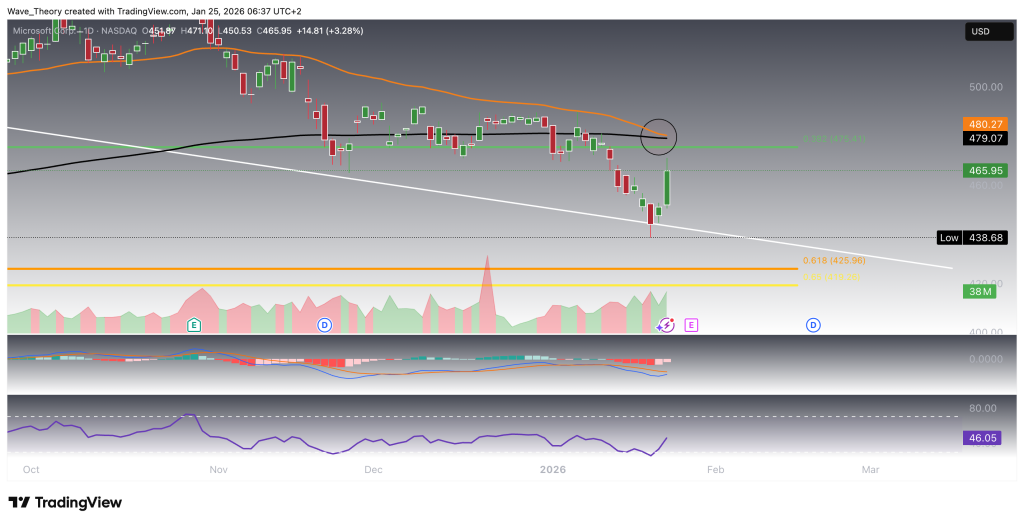
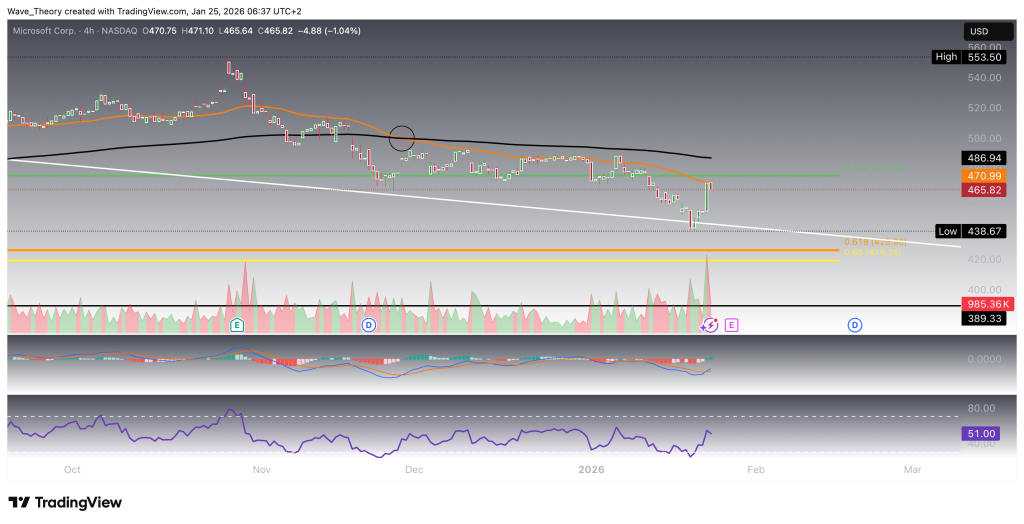
Death Cross On The 4H Chart
On the 4H chart the EMAs have already established a death cross, which confirms the trend bearishly in the short-term. However, the MACD lines are bullishly crossed and the MACD histogram is ticking bullishly higher, while the RSI moves in neutral regions. For now, Microsoft finds significant resistance at the 5o-4H-EMA at $471. Should Microsoft break this level, it could reach the 200-4H-EMA at $487.
Microsoft (MSFT) — Multi-Timeframe Summary & Key Levels
Microsoft remains in a broader corrective phase after the rejection at the all-time high of $555.5. While the long-term trend is still structurally bullish (monthly golden crossover intact), momentum has weakened meaningfully, and downside risk remains elevated in the near to medium term.
- Major resistance:
- $471 – 50-4H-EMA (immediate resistance)
- $487 – 200-4H-EMA
- $475 – former 0.382 Fib support, now resistance
- Key support levels:
- $420 – golden ratio Fib support (critical downside target)
- $389–$350 – historical support zone
Trend & momentum overview:
- Monthly: Golden crossover still intact (long-term bullish), but MACD histogram declining and a potential bearish MACD cross signals weakening momentum.
- Weekly: Trend remains mid-term bullish (golden crossover), yet MACD lines are bearish and price risks further downside toward $420.
- Daily & 4H: Short-term structure is bearish, with a confirmed death cross on the 4H chart and a potential death cross forming on the daily. Momentum indicators show early bullish counter-signals, but no confirmed trend reversal yet.
Bottom line:
As long as MSFT trades below $471–$487, the bias remains cautiously bearish, with a likely test of $420. A sustained break above this resistance zone would be required to invalidate the corrective scenario and re-establish bullish continuation.
- Check out our free forex signals
- Follow the top economic events on FX Leaders economic calendar
- Trade better, discover more Forex Trading Strategies
- Open a FREE Trading Account