BTC Price Forecast: Buyers Reactivate as Institutional Flows Build Next Bull Cycle After Correction
Bitcoin began 2026 under heavy pressure after plunging to $60,000, but improving institutional flows, long-term accumulation, and resilient

Quick overview
- Bitcoin started 2026 under pressure, dropping to $60,000, but signs of institutional demand and network stability suggest potential for recovery.
- The $60,000 level has emerged as a critical support zone, with a rebound above $70,000 restoring short-term confidence.
- Renewed inflows into Bitcoin ETFs indicate growing institutional interest, treating price corrections as accumulation opportunities.
- Long-term holders are shifting back into accumulation mode, signaling confidence in Bitcoin's value despite recent volatility.
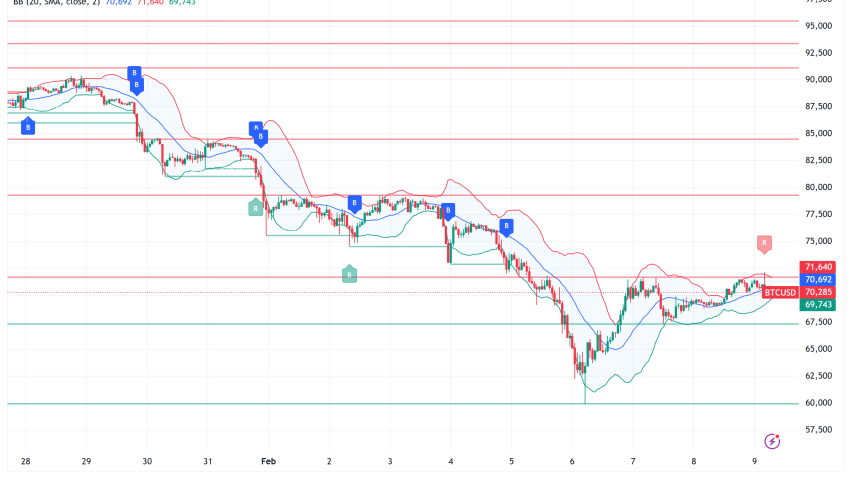
Live BTC/USD Chart

Bitcoin began 2026 under heavy pressure after plunging to $60,000, but improving institutional flows, long-term accumulation, and resilient network fundamentals suggest the groundwork for a potential next advance may already be forming.
Bitcoin Opens 2026 Under Renewed Pressure
Bitcoin entered the new year facing renewed volatility, reflecting a shifting balance between macro uncertainty and long-term structural demand. After reaching record highs in late 2025, the cryptocurrency experienced a sharp correction, falling toward the $60,000 level and briefly wiping out roughly half of the value gained since the October peak.
Selling pressure intensified as broader financial markets experienced periodic risk-off sentiment, reminding investors that Bitcoin, despite its growing institutional adoption, still trades within the global liquidity cycle. Yet the decline did not trigger panic liquidation on the scale seen in earlier cycles. Instead, the market showed early signs of stabilization, suggesting that underlying structural demand remains intact.
The $60,000 region quickly emerged as a key battleground. This area aligns closely with long-term technical support, including the 200-week moving average, and has historically attracted strong buying interest. The successful defense of that level allowed Bitcoin to rebound sharply, pushing back above the $70,000 region and restoring short-term confidence.
Technical Structure Defines the Next Inflection Point
From a technical perspective, Bitcoin’s price behavior early in 2026 reflects a classic consolidation phase following an extended rally. At the start of January, BTC had recovered strongly from late-2025 volatility, climbing toward the $100,000 level after rebounding from the 100-week moving average.
BTC/USD Chart Weekly – The 200 SMA Held the Decline

That recovery, however, proved temporary. Selling accelerated later in the month, pushing Bitcoin decisively below the 100-week moving average for the first time since 2023 and signaling that the market had entered a corrective phase. The decline ultimately stabilized near the 200-week moving average around $60,000, reinforcing the importance of that level as long-term structural support.
As long as this zone holds, the broader bullish trend remains technically intact. A sustained break below it could open the door to deeper downside toward the psychologically important $50,000 region. Conversely, continued stability above the $60,000–$70,000 range increases the probability of a gradual recovery toward $100,000 and, over time, the $120,000–$126,000 region.
ETF Flows Signal a Quiet Return of Institutional Demand
One of the most encouraging developments has come from the ETF market. While spot prices experienced significant volatility, U.S.-listed spot Bitcoin ETFs began attracting renewed inflows after a period of withdrawals late in 2025.
January data indicates approximately $1.2 billion in net inflows month-to-date, with one mid-January week alone recording roughly $1.42 billion in new allocations. Several individual trading sessions saw inflows exceeding $800 million, highlighting the scale of institutional participation returning to the market.
Total assets held by U.S. spot Bitcoin ETFs have climbed to roughly $124 billion, while cumulative inflows since launch approach $58 billion. These figures suggest that large allocators are increasingly treating Bitcoin corrections as accumulation opportunities rather than exit signals. The persistence of these inflows, even during periods of price weakness, points to a more mature demand base than in earlier cycles.
Network Fundamentals Reinforce the Scarcity Narrative
Beyond capital flows, Bitcoin’s network metrics continue to strengthen. Mining difficulty and hashrate reached new records throughout 2025, reflecting ongoing investment in infrastructure and confidence among mining operators.
The network’s seven-day average hashrate surpassed the symbolic milestone of one zettahash per second before rising further toward approximately 1.15 ZH/s. Increasing computational power raises the cost of production and enhances network security, reinforcing the long-term scarcity narrative that underpins Bitcoin’s value proposition.
As mining becomes increasingly capital-intensive, market acquisition of Bitcoin often becomes more attractive relative to production, subtly shifting incentives toward accumulation among institutions and long-term investors.
Long-Term Holders Shift Back Into Accumulation Mode
On-chain data offers additional insight into market behavior beneath the surface. The Hodler Net Position Change—an indicator tracking wallets holding Bitcoin for more than 155 days—turned positive in late December for the first time in several months. This shift suggests that long-term investors have resumed net accumulation after a period of distribution during the late-2025 rally.
Historically, long-term holders tend to accumulate during consolidation phases and reduce exposure near cycle peaks. Their renewed buying activity, combined with ETF inflows, signals growing conviction that current price levels represent attractive long-term value rather than the start of a prolonged downturn.
Institutional Participation Continues to Reshape Market Dynamics
Institutional capital remains one of the defining features of the current Bitcoin cycle. Large corporate and institutional holders now control a meaningful share of circulating supply, reducing the probability of disorderly liquidation events driven by retail leverage.
MicroStrategy (Strategy), for example, continues to maintain one of the largest corporate Bitcoin positions, holding hundreds of thousands of coins. Such deeply capitalized holders are structurally less likely to engage in forced selling during volatility, providing a stabilizing effect on market structure.
The growing presence of ETFs, corporate treasuries, pension funds, and sovereign investors has gradually changed Bitcoin’s market “DNA,” shifting it from a predominantly speculative retail asset toward a hybrid institutional macro asset.
Miner Economics Add Short-Term Pressure, Not Structural Risk
Bitcoin’s recent decline has pushed prices closer to estimated average production costs, increasing pressure on higher-cost mining operations. Some miners may need to liquidate holdings to cover operating expenses, adding short-term supply to the market.
However, miner selling now plays a far smaller role in determining price direction than in earlier cycles. Institutional flows, ETF demand, and long-term holder accumulation increasingly dominate supply-demand dynamics, limiting the impact of mining-related selling.
The Road Ahead: Consolidation or the Next Advance?
The coming weeks will determine whether Bitcoin’s early-2026 pullback represents a temporary consolidation or the beginning of a deeper corrective phase. Key macroeconomic catalysts—including employment data, inflation releases, and Federal Reserve communications—will shape global liquidity conditions and risk appetite.
If ETF inflows continue and long-term holders remain in accumulation mode, the recent correction may ultimately be remembered as a reset within an ongoing bull market rather than a trend reversal. The successful defense of the $60,000 support zone already suggests that structural demand remains strong.
For now, Bitcoin’s price action reflects a market transitioning from momentum-driven speculation to institutionally anchored consolidation. Volatility remains elevated, but beneath the surface, the foundations of the next major move may already be taking shape.
- Check out our free forex signals
- Follow the top economic events on FX Leaders economic calendar
- Trade better, discover more Forex Trading Strategies
- Open a FREE Trading Account
- Read our latest reviews on: Avatrade, Exness, HFM and XM