Ethereum Holds $2,000 Support: Accumulation Zone or Just the First Low?
Ethereum (ETH) is currently trading at about $2,000, down 4% over the last day. Analysts are comparing the current 31% year-to-date decline
Quick overview
- Ethereum is currently trading around $2,000, down 4% in the last day, with analysts predicting a prolonged consolidation period.
- Historical trends suggest that ETH's recent decline may be the 'first low' in a longer consolidation phase, with potential fluctuations between $1,300 and $2,000.
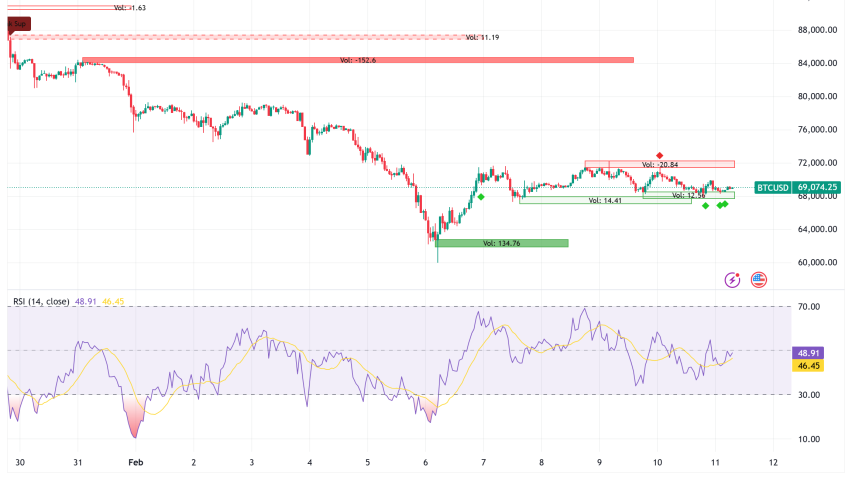
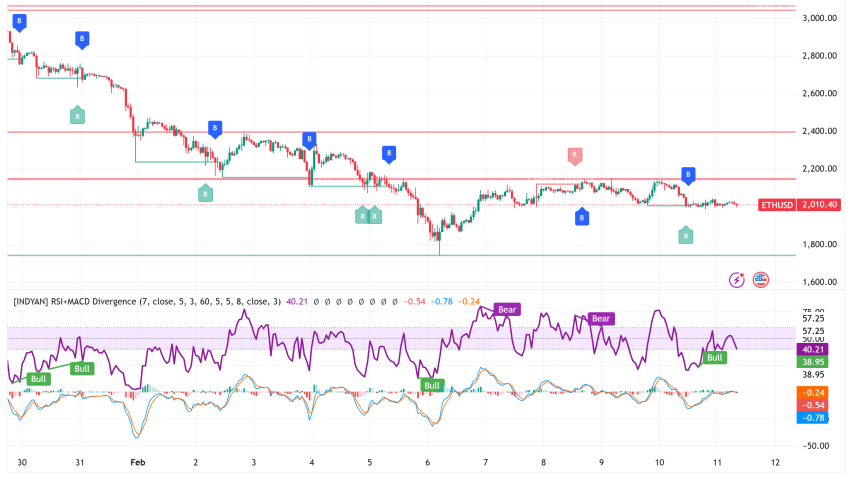
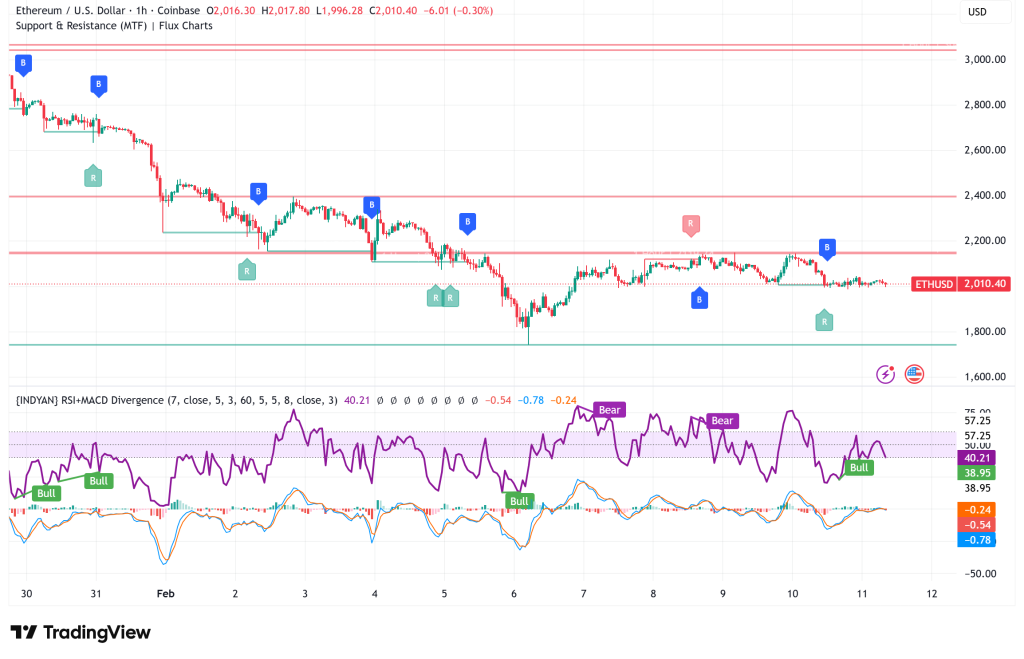
- Technical indicators remain bearish, with immediate resistance at $2,040-$2,050 and crucial support at $1,950.
- Despite bearish signals, some analysts believe that future repricing could occur due to increased stablecoin transaction volume and significant ETH withdrawals.
With increasing technical pressure threatening to force the second-largest cryptocurrency into a protracted consolidation period, Ethereum ETH/USD is currently trading at about $2,000, down 4% over the last day. Analysts are comparing the current 31% year-to-date decline to past trends, which indicate that additional downward testing would be required before any long-term recovery.
Historical Fractal Points to Multi-Month Consolidation
There are notable parallels between Ethereum’s 2021–2022 cycle and its current price behavior, according to market specialists. Fractal research suggests that rather than a clear market bottom, ETH’s recent decline below $1,736 is probably just the “first low” in a longer period of consolidation.
Before starting a steady upward trend in 2021, Ethereum oscillated for over a year between an initial low of about $1,730 and deeper support at $885. Using this paradigm in light of the current situation, analysts predict that ETH could fluctuate between $1,300 and $2,000 in the upcoming months, with possible tests towards $1,500 to $1,600 prior to establishing a stable basis.
On-Chain Data Maps Critical Support and Resistance Zones
Significant obstacles to upward movement are created by the strong overhead resistance at $2,822 (5.86% of ETH supply) and $3,119 (6.15%), according to Ethereum’s UTXO Realized Price Distribution (URPD) data. Significant demand clusters that indicate possible support zones below present levels can be seen at $1,881 (1.58 million ETH) and $1,237.
This perspective is supported by derivatives data. Vulnerability to seller pressure is indicated by the liquidation heat map, which displays $4-6 billion in cumulative long liquidations at danger between $1,455 and $1,700. But more than $12 billion in short liquidity is stacked up to $3,000, suggesting that once downside liquidations are absorbed, directional bias may move higher.
ETH/USD Near-Term Technical Setup Remains Bearish
Ethereum encounters immediate opposition on shorter timeframes at $2,040-$2,050, where a contracting triangle pattern has developed. Following a quick surge to $2,168, ETH had a correction below the 100-hour SMA. $2,065 and $2,120 are important resistance levels; a break over these might target $2,165–$2,280. With the hourly MACD in the bearish zone and the RSI below 50, technical indicators are still pessimistic.
$2,000 is the downside support, while $1,950 is the primary support. Declines toward $1,900 or $1,820 could be triggered by a break below $1,950.
Ambitious Price Targets Face Reality Check
It looks more difficult to meet Standard Chartered’s prediction of $7,500 by the end of 2026. It would take a 275% rise in less than ten months to reach this goal from present prices, requiring drastic changes like consistent inflows into Spot Ethereum ETFs and a notable improvement in the ETH/BTC ratio.
There are some encouraging indications despite the bearish technicals. According to CryptoQuant statistics, net outflows of more than 220,000 ETH caused exchange withdrawals to spike to all-time highs in October 2025. Last Thursday, Binance reported daily outflows of 158,000 ETH, indicating possible buildup. Furthermore, Ethereum’s stablecoin transaction volume has grown 200% in the last 18 months, despite ETH prices remaining 30% lower. Some analysts feel this discrepancy may lead to future repricing.
Ethereum Price Prediction: Extended Range-Bound Trading Expected
Technical and on-chain convergence suggest that Ethereum will probably be range-bound between $1,300 and $2,000 for a while. In order to establish a definitive bottom, the route of least resistance suggests retesting between $1,500 and $1,600. The probabilities have drastically decreased, but the $7,500 year-end targets are still mathematically achievable. If bulls recover $2,150, more realistic short-term goals include a gradual comeback toward $2,500–$3,000.
As Ethereum moves through its consolidation period, traders should brace themselves for ongoing volatility and possible downward tests. The crucial support level to keep an eye on is $1,950.
- Check out our free forex signals
- Follow the top economic events on FX Leaders economic calendar
- Trade better, discover more Forex Trading Strategies
- Open a FREE Trading Account
- Read our latest reviews on: Avatrade, Exness, HFM and XM