Forex Signals Feb 13: Mixed CPI Inflation Expectations as Earnings Volatility Rattles the Markets
Following a rough session, markets now look to the US CPI for information on inflation, the timing of rate cuts, and the results of Enbridge
•
Last updated: Friday, February 13, 2026

Quick overview
- Markets are focused on the upcoming US CPI report for insights on inflation and potential rate cuts, following a day of risk aversion and defensive capital rotation.
- Equities struggled, particularly in the software sector, while bonds saw increased demand amid fears of recession despite strong job data.
- Gold experienced significant volatility, dropping nearly $100, which raised speculation about a possible CPI leak, while oil prices weakened amid geopolitical tensions.
- Major earnings reports from companies like Enbridge and NatWest are expected today, with market sensitivity heightened due to ongoing inflation uncertainty.
Following a rough session, markets now look to the US CPI for information on inflation, the timing of rate cuts, and the results of Enbridge, NatWest, TC Energy, and Cameco.
Yesterday’s Market Recap: Risk Aversion Spreads
Nothing Felt Safe — Except Bonds
Yesterday’s session carried a clear message: capital rotated defensively as equities struggled across multiple sectors. Software stocks led declines, highlighting fragile sentiment in high-multiple growth names.
Trucking and commercial real estate joined the selloff, with some names falling 20% intraday. Several stocks traded as though recession risk had suddenly intensified — despite recent strong non-farm payroll data.
The day began relatively flat. Initial jobless claims came in on the softer side but failed to move markets. The turning point came when Applovin plunged roughly 16%, even after beating on both revenue and earnings. It was a stark reminder that in the current environment, even strong results may not protect against repricing.
Fear spread into the close, reinforcing how quickly market leaders can reverse when expectations are stretched.
Cross-Asset Signals Added to the Unease
Gold dropped nearly $100 within minutes, an abrupt move that sparked speculation — including rumors of a potential CPI leak ahead of today’s report. The 30-year Treasury auction saw its largest stop-through since “Liberation Day,” signaling aggressive bond demand.
Oil prices weakened following comments tied to President Trump and Israeli Prime Minister Netanyahu, with indications pointing toward at least a month of negotiations. Notably, bonds had previously resisted validating the turmoil in equities. That dynamic may now be shifting, suggesting broader risk recalibration.
Despite widespread damage beneath the surface, the S&P 500 remains just 3% below record highs, creating a disconnect between index resilience and underlying weakness.
Key Market Events to Watch Today: Key Corporate Reports to Watch
US January 2026 CPI
Consensus Expectations
- Headline CPI: +0.3% m/m, +2.5% y/y (down from 2.7%)
- Core CPI: +0.3% m/m, +2.5% y/y (down from 2.6%)
Cleveland Fed Nowcast
- Headline: ~+0.13% m/m (cooler than consensus)
- Core: ~+0.22% m/m
The divergence between economist consensus and model-based nowcasts increases the potential for surprise.
What Markets Care About
- Core services inflation, particularly wage-sensitive categories
- Shelter trends and rental disinflation progress
- “Supercore” measures (core services ex-shelter)
- Month-on-month stickiness that could delay Fed easing
A cooler-than-expected core print would likely revive expectations for mid-year rate cuts. A hotter, sticky reading could push cuts further out, lift Treasury yields, and support the US dollar under a “higher-for-longer” repricing.
Earnings to Watch Today
Several major names report fourth-quarter results:
- Enbridge Inc. (Q4, BMO)
- NatWest Group plc (Q4, BMO)
- TC Energy Corporation (Q4, BMO)
- Cameco Corporation (Q4, BMO)
Given the fragile backdrop, even solid earnings may face heightened scrutiny. With inflation uncertainty and rate expectations in flux, markets remain highly sensitive to both macro data and forward guidance.
Gold Resumes the Decline Again As Safe Havens Lose Status
Although demand for safe haven assets is still high, gold fell precipitously from record highs following the Fed’s most recent rate cut comments, as profit-taking was prompted by Powell’s cautious tone. In December, gold jumped above $4.3800 following the Federal Reserve’s announcement of a 25 basis point rate decrease. But the impetus soon waned, and prices dropped back to $4,004. The 20 daily SMA (gray) held as support last week and buyers returned and pushed XAU above the $5,000 mark for the first time during Asian hours and extended the rally in New York, printing a fresh record high near $5,111 before retreating below $5,000 late in the session. But buyers returned and XAU climbed to $5,598 but pulled back below $5,000 again.
USD/JPY Returns Back Down
Foreign exchange markets saw sharp swings. Early in the week, U.S. yield differentials and Japanese capital outflows pushed the dollar above ¥150, but disappointing U.S. jobs data triggered profit-taking, causing the USD/JPY to slide by four yen from its peak. However, the new BOJ governor the JPY has weakened and USD/JPY soared to 154 and we decided to close our buy signal for more than 80 pips as the pair found support at the 20 daily SMA (gray) and has rebounded more than 200 pips off that MA but reversed after the 25 bps rate cut from the FED. The price approached $160 but reversed after the BOJ meeting and fell 8 cents but found support at $152 at the 100 daily SMA (red) and rebounded above 156 but have reversed down again this week after the Japanese elections.
USD/JPY – Daily Chart
Cryptocurrency Update
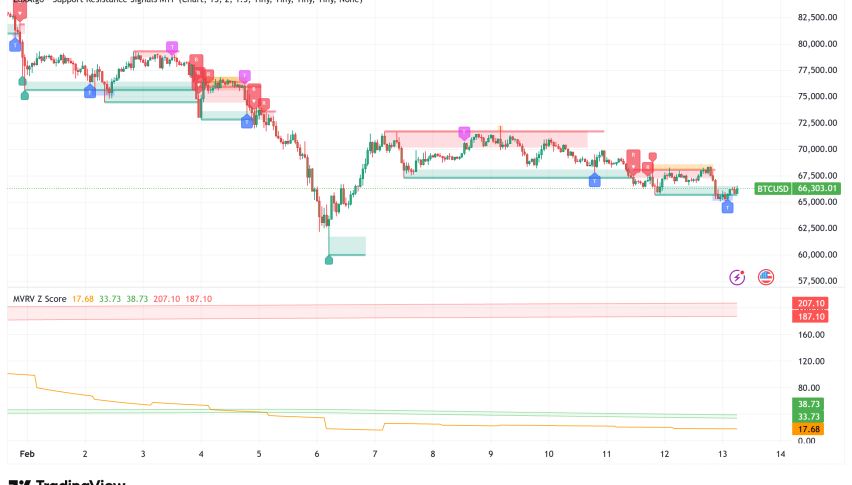
Bitcoin Returns Under $70K
Cryptocurrencies remained highly active over the summer. Bitcoin (BTC) climbed to fresh highs of $123,000 and $124,000 in July and August, supported by institutional inflows and technical strength. However, remarks from Treasury Secretary Scott Bessent ruling out U.S. increases to BTC reserves triggered a steep pullback, sending the coin down to $80K before finding support at the 100 weekly SMA (green). A rebound followed, sending BTC near $100 is the first major text for Bitcoin buyers. However BTC returned lower and fell below $80K, breaking below the but the 100 weekly SMA (green) but the decline stopped at the $60K support where the 200 weekly SM A(purpe) stands and rebounded above $70K.
BTC/USD – Weekly Chart
Ethereum Slips Below $2,000
Ethereum (ETH) has been similarly strong, surging toward $4,800, its highest since 2021 and near its all-time peak of $4,860. Despite a dip last week, ETH found support at the 20-day SMA, with retail enthusiasm and renewed institutional participation driving fresh upside momentum. Last week we saw a dive below $2,000 but buyers returned n d pushed the price above $2K again.
ETH/USD – Weekly Chart
- Check out our free forex signals
- Follow the top economic events on FX Leaders economic calendar
- Trade better, discover more Forex Trading Strategies
- Open a FREE Trading Account
- Read our latest reviews on: Avatrade, Exness, HFM and XM
ABOUT THE AUTHOR
See More
Skerdian Meta
Lead Analyst
Skerdian Meta Lead Analyst.
Skerdian is a professional Forex trader and a market analyst. He has been actively engaged in market analysis for the past 11 years. Before becoming our head analyst, Skerdian served as a trader and market analyst in Saxo Bank's local branch, Aksioner. Skerdian specialized in experimenting with developing models and hands-on trading. Skerdian has a masters degree in finance and investment.