Ethereum Teeters at $1,800 as Bears Tighten Grip: Key Levels Could Decide ETH’s Next Move
Ethereum (ETH) is holding precariously around $1,800 at the time of writing, down roughly 5.7% over the past 24 hours, as a broad risk-off
Quick overview
- Ethereum is currently trading around $1,800, down approximately 5.7% in the last 24 hours amid a broader risk-off sentiment in the crypto market.
- The CMC Fear & Greed Index indicates extreme fear at a reading of 14, suggesting potential market surrender but not necessarily a quick recovery.
- Technical indicators show a clear downtrend for ETH, with significant support levels broken and the price down about 34% year-to-date.
- The critical support level to watch is $1,749, with potential consolidation between $1,750 and $1,970 if it holds, while a break below could lead to further declines.
Ethereum ETH/USD is holding precariously around $1,800 at the time of writing, down roughly 5.7% over the past 24 hours, as a broad risk-off wave sweeps across crypto markets. Bitcoin BTC/USD has led the slide at -4.64%, while the overall value of the cryptocurrency market has dropped to $2.23 trillion, a 4.31% decrease. Ethereum’s somewhat greater decline is consistent with its distinctive high-beta tendency, which is that it typically declines more forcefully and quickly than the market leader when sentiment sours.
The extreme fear reading of 14, which has historically been linked to surrender but does not necessarily have a quick bottom, has been reached by the CMC Fear & Greed Index.
ETH/USD Technical Structure Confirms Downtrend: Oversold But Not Yet Reversed
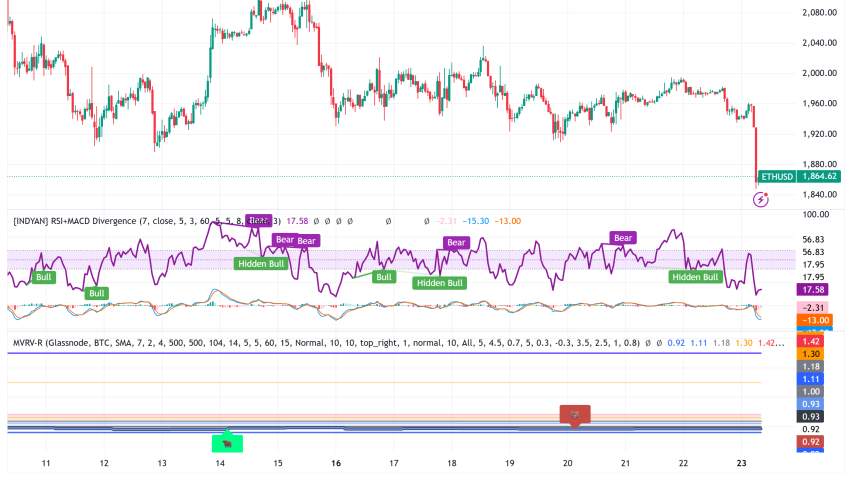
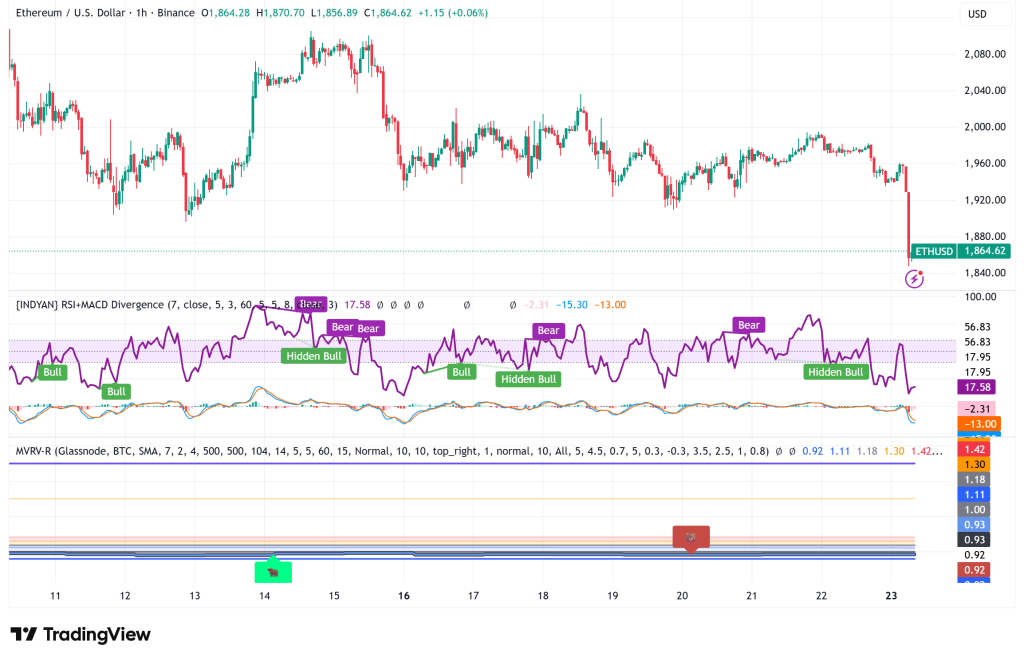
ETH’s technical picture is clearly negative on a number of timeframes. Bulls had been defending two important layers of dynamic support, but the price has clearly broken below both the 30-day SMA ($2,255) and the 7-day SMA ($1,970). With the 50-day MA resting well above at $2,683 and the 200-day MA at $3,514, levels that appear almost theoretical given the present momentum, ETH is currently down about 34% year to date.
The RSI-14 has fallen to about 31–34 on the daily chart, which is deep into oversold territory. The fact that the ADX is reading close to 47 and the MACD is quite negative confirms that this is a strong, ongoing downturn rather than a weak or ambiguous one. Although they are not reversal indications in and of themselves, stochastic oscillators also sit in oversold zones, which historically indicate regions where short-term bounces appear.
With resistance at $1,950, a bearish trend line has developed on the hourly chart, and ETH has yet to recover the $1,920 mark. Bears are still clearly in charge of short-term price action, as evidenced by the modest comeback from the $1,845 area that has halted well below the 23.6% Fibonacci retracement of the previous $1,994–$1,845 swing.
ETH Staking Data and On-Chain Signals Add to Bearish Backdrop
On-chain data provides a cautious but mixed picture beyond price activity. From almost 1.99 million ETH on January 13 to slightly over 1 million ETH on February 22, Ethereum’s net staking deposits have decreased by about 50%, suggesting a decrease in staking demand and an increase in liquid supply that may affect pricing. There is typically more potential selling pressure when there is more liquid ETH in circulation.
On the plus side, Ethereum is the most discounted major cryptocurrency according to the 30-day MVRV ratio, which indicates the asset is undervalued by about 14.3%. Additionally, since Robinhood launched the feature in December, staking activity has become more widely used. The sell-off may be nearing a zone of longer-term value for patient investors, but these considerations don’t change the trend.
Ethereum Price Prediction: $1,749 Is the Line in the Sand
The latest swing low of $1,749 is the most important level to monitor in the immediate future. A consolidation range between $1,750 and $1,970 is conceivable if ETH stays above this level, giving the market time to process recent losses. The first indication that buyers are coming back with any conviction would be a recovery of $1,920 to $1,950, with $2,000 serving as a key psychological and technical ceiling beyond that.
On the down side, the $1,600–1,700 support zone would become accessible if there was a verified break below $1,749 on high volume. The 52-week low at $1,383 is the worst-case scenario if macro conditions worsen much more, and the lower Bollinger Band is at $1,464. If selling pressure doesn’t stop, monthly forecast models are already predicting a possible test of $1,370.
- Check out our free forex signals
- Follow the top economic events on FX Leaders economic calendar
- Trade better, discover more Forex Trading Strategies
- Open a FREE Trading Account
- Read our latest reviews on: Avatrade, Exness, HFM and XM
Related Articles
Sidebar rates
Related Posts