Bitcoin Reclaims $66,000 on Macro Tailwinds and Oversold Bounce, But Key Resistance Looms
As global risk assets continue to recover, Bitcoin (BTC) is currently trading at about $66,000 on Wednesday, February 25, 2026, up about
Quick overview
- Bitcoin is currently trading at approximately $66,000, reflecting a 2.84% increase over the last day amid a broader recovery in global risk assets.
- The recent price movement is characterized as a technically driven relief bounce rather than the onset of a new bullish trend, with a high correlation to the S&P 500.
- Key levels to monitor include the $66,572 Fibonacci retracement, which is crucial for determining the near-term direction of Bitcoin's price.
- On-chain data indicates a 'neutrally defensive' market state, suggesting that while there is no significant bullish momentum, the potential for a longer-term bullish narrative exists due to hashrate recovery.
As global risk assets continue to recover, Bitcoin BTC/USD is currently trading at about $66,000 on Wednesday, February 25, 2026, up about 2.84% over the last day. With on-chain and derivatives data indicating the rise is a technically driven relief bounce rather than the start of a new bullish trend, the move reflects a 0.66% increase in the S&P 500.
Bitcoin is now tracking a 2.36% increase in the overall market capitalization of cryptocurrencies at $66,022. Over the last 24 hours, the correlation between Bitcoin and the S&P 500 recorded an exceptionally high 94.8%, indicating that the main driver is macro forces rather than crypto-specific catalysts. Although mood received a slight secondary boost from the Federal Reserve’s suggestion to stop “debanking” legitimate cryptocurrency companies, the action is best interpreted as a high-beta reaction to an improvement in risk appetite across all stocks.
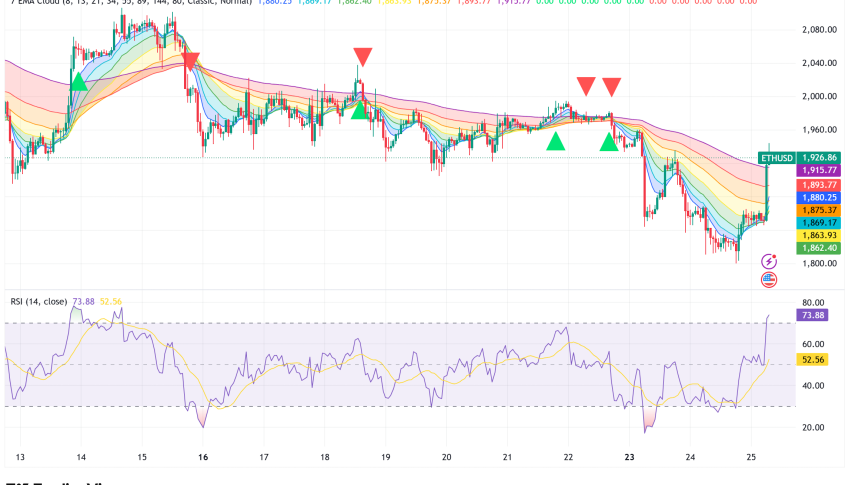
RSI and Fibonacci Data Point to a Technically Oversold Bounce
Technically speaking, extremely oversold conditions were the catalyst for Bitcoin’s surge. Prior to the move, the 14-period Relative Strength Index (RSI) had dropped to just 30.87, a level that has historically been linked to brief price rallies. At the same time, 24-hour derivatives liquidations decreased 21.86% to $95.76 million, relieving the market of the pressure from forced selling that had been present in recent sessions.
Importantly, around $66,572, BTC recovered the 78.6% Fibonacci retracement level, a theoretically noteworthy area where buyers have often re-entered. The price activity around these two levels will determine whether this rally has legs. The 7-day Simple Moving Average (SMA) is located close around $66,535.
The RSI must rise over 50 for bulls in order to verify consistent momentum. The market is currently experiencing respite rather than a reversal.
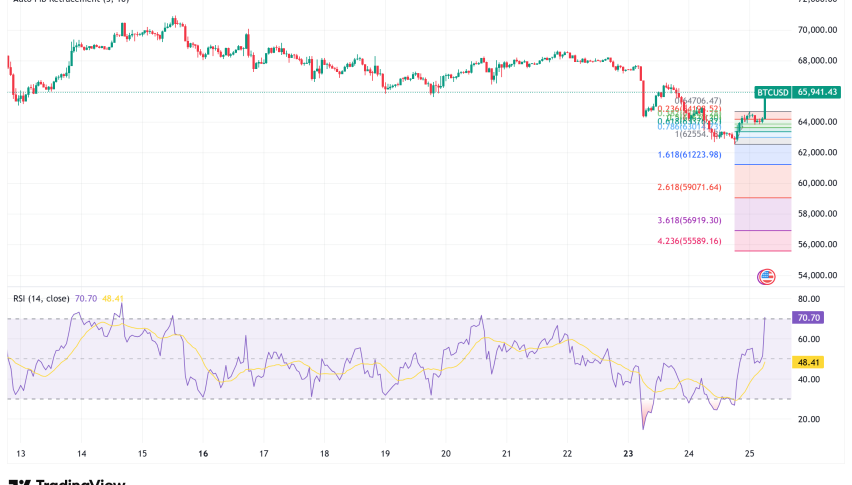
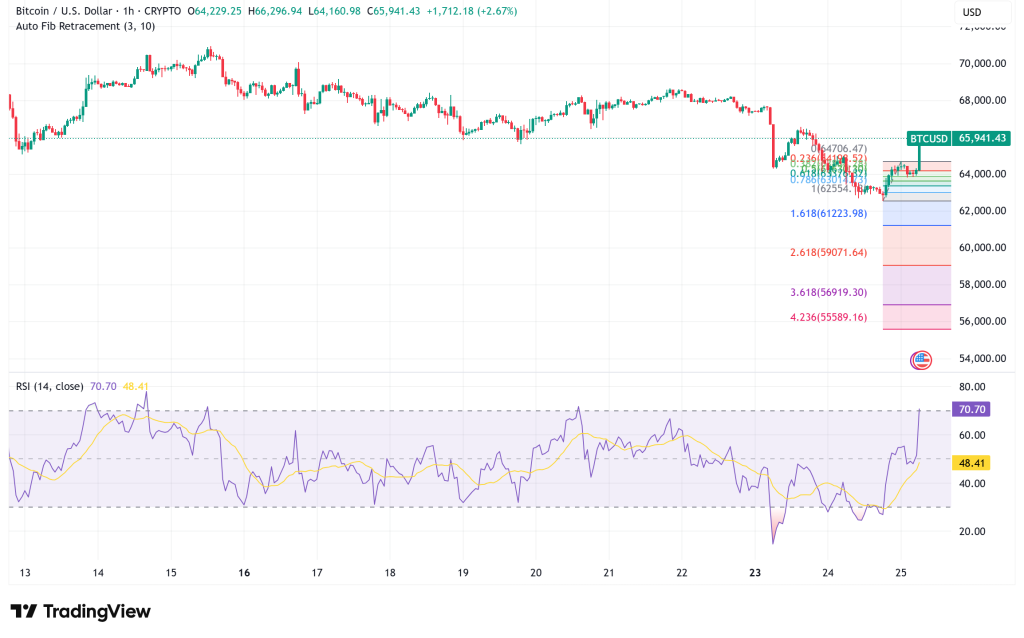
$66,572 Is the Make-or-Break Level for Near-Term Direction
The prognosis for the immediate future is precariously balanced. The 7-day SMA at $66,535 and the psychological resistance at $68,000–$70,000 are the next upward targets for Bitcoin if it can consolidate above the $66,572 Fibonacci support and develop volume.
The recent swing low around $60,074 would be accessible if BTC were to fail to hold $66,572, which would expose it to a retest of the $64,000 support level. Glassnode’s on-chain data adds even more caution: while spot trading volume dropped from $7.6 billion to $6.0 billion, the spot Cumulative Volume Delta (CVD) improved slightly from -$177.1 million to -$161.5 million, indicating choppy conditions and low participation rather than a robust demand recovery.
Bitcoin’s On-Chain Signals Flash “Neutrally Defensive” — Not Yet Bullish
The underlying on-chain fundamentals of Bitcoin reveal a market in a defensive, transitional stage. After its previous +1 standard deviation extreme was completely reset, the Market Value to Realized Value (MVRV) ratio normalized, bringing valuations close to levels that have historically provided better risk-reward. However, Bitcoin has not yet reached significantly low prices.
From its peak of $1.12 trillion in November 2025, the realized capitalization has fallen to $1.09 trillion, indicating a reduction of around $33 billion in network value. The realized cap change over the last 30 days is -2.26%, indicating ongoing capital withdrawals. At 25.9%, coins that are three to six months old now make up the largest supply cohort. Since many of these holdings were created close to cycle highs and are now underwater, there is pressure on the supply from above.
Chris Beamish, an analyst at Glassnode, describes the current state of affairs as a “neutrally defensive” phase, meaning that while holders are not shrinking in size, the realized cap trend has not yet been reversed by fresh capital inflows. A more optimistic indication would be a return to positive momentum in realized cap.
Hashrate Recovery and Sovereign Mining Add a Longer-Term Bullish Thesis
Analysts are increasingly adopting a structural narrative that looks beyond the short-term technicals. The early 2026 hashrate recovery of Bitcoin has been cited by former CoinRoutes CEO Dave Weisberger as a possible leading indicator of a more significant price change to come. Computational power recovered from below 900 EH/s to above 1 ZH/s, with one of the biggest absolute difficulty rises on record at almost 15%, following a dramatic decline of about 15–20% from previous peaks.
According to Weisberger, the rebound goes beyond a simple return to normalcy after winter curtailments and post-halving margin compression. He argues that sovereign miners have different time horizons than private operators and are less motivated to sell output into market weakness. He bases this on VanEck research that demonstrates that at least 13 nation-states currently mine Bitcoin at a governmental or state-linked level, including Bhutan, the UAE, Russia, Iran, and Ethiopia. Sovereign mining tightens sell-side supply and improves network security in this environment by serving as a structural absorption mechanism for newly produced Bitcoin.
Although it is still speculative, the analogy to central bank gold purchases, which came before gold’s parabolic rise, is worth keeping an eye on as a longer-term theory.
Bitcoin Price Prediction: Cautious Relief With Elevated Downside Risk
- Short-term (24–72 hours): As the market processes the surge, Bitcoin is probably going to settle between $65,000 and $67,500. A push toward $68,000 would require at least a hold above $66,572 with recovering spot volume. The likelihood of revisiting $64,000 would rise if there was a drop below $65,000, which would indicate rejection at resistance.
- Medium-term (1–3 weeks): The dominating trend will continue to be corrective until on-chain data indicates a reversal in the realized cap trend and the spot CVD makes a clear bullish move. The perspective would change to moderately bullish with a sustained closure above the 7-day SMA, an RSI above 50, and improved spot volume. With swing lows close to $60,000 still in play on a macro basis, any rally should be viewed as a relief bounce within a larger downtrend until that time.
Key level to watch: $66,572 (Fibonacci 78.6% support/resistance). It is the pivot that separates the relief case from the bearish continuation.
- Check out our free forex signals
- Follow the top economic events on FX Leaders economic calendar
- Trade better, discover more Forex Trading Strategies
- Open a FREE Trading Account
- Read our latest reviews on: Avatrade, Exness, HFM and XM