Can Ethereum Bulls Reclaim $2,120 and Trigger the Next Leg Up?
Ethereum (ETH) trades at $2,028 after a 2.3% decline, tracking Bitcoin's fall as the Fear & Greed Index sits at Extreme Fear (16). Key
Quick overview
- Ethereum is currently trading at $2,028 after a 2.3% decline, influenced by a broader market sell-off and extreme fear sentiment.
- Key support at $1,975 is critical for any potential rally towards $2,220, while a failure to hold this level could lead to further declines.
- The whale cost basis between $2,100 and $2,120 is significant, as closing above this range could relieve selling pressure from large holders.
- Short-term price action is likely to remain sideways between $1,950 and $2,100, with Bitcoin's performance being a key factor in determining ETH's direction.
Ethereum ETH/USD trades at $2,028 after a 2.3% decline, tracking Bitcoin’s BTC/USD fall as the Fear & Greed Index sits at Extreme Fear (16). Key support at $1,975 must hold for any rally toward $2,220 to materialise.
Market-Wide Risk-Off Selling Drags ETH Below $2,050
As of this writing, Ethereum is down about 2.3% over the last day, trading at about $2,028; this loss closely resembles that of Bitcoin, which has dropped 1.34%, and the overall crypto market value, which has dropped 1.09%. There is no catalyst unique to Ethereum in the sell-off. ETH rises in lockstep with the market leader when macro or sector-wide risk aversion sets in, indicating pure beta-driven selling pressure instead. Sentiment is still extremely cautious, with the CoinMarketCap Fear & Greed Index showing an extreme fear reading of just 16. Bitcoin stabilization is probably necessary before any long-term rebound in ETH can occur.
This story is supported by derivatives markets. Funding rates quickly decreased and perpetual open interest plummeted 8.22%, both signs of general deleveraging rather than bearish posture specific to ETH. Additionally, trading volume fell 17.28%, indicating that buyers are not yet actively intervening to stop the decline.
The $2,100 Whale Cost Basis: The Level That Defines the Short-Term Trend
ETH hit a weekly high of $2,150 earlier this week, despite the subsequent decline, and that level is significant. According to CryptoQuant’s on-chain statistics, wallets holding 100,000 ETH or more achieved a price between $2,100 and $2,120. Instead of being a straightforward spot price reference, the realized price serves as a measure of profitability by tracking the average cost basis of each wallet’s assets.
Only a few occasions since 2020 has ETH fallen below the realized price of this whale cohort, most notably during the bear market of 2022. In most cases, the level has served as a floor prior to recoveries. A consistent daily closing above $2,100 would indicate that these big holders are making money again, which would relieve some of the market’s sell pressure. ETH is technically susceptible until that close is made.
The price just tapped the one-month rolling VWAP and the value area high, which is the upper boundary of the zone where the majority of trading volume has happened over the last month, according to futures analyst Dom, who characterized the current setup as a “clean” market structure. A positive change in order flow would be indicated by acceptance above $2,140; ETH remains trapped within its predetermined range if it is unable to hold above that level.
Technical Picture: SuperTrend Resistance, Fibonacci Levels, and the $1,800 Liquidity Trap
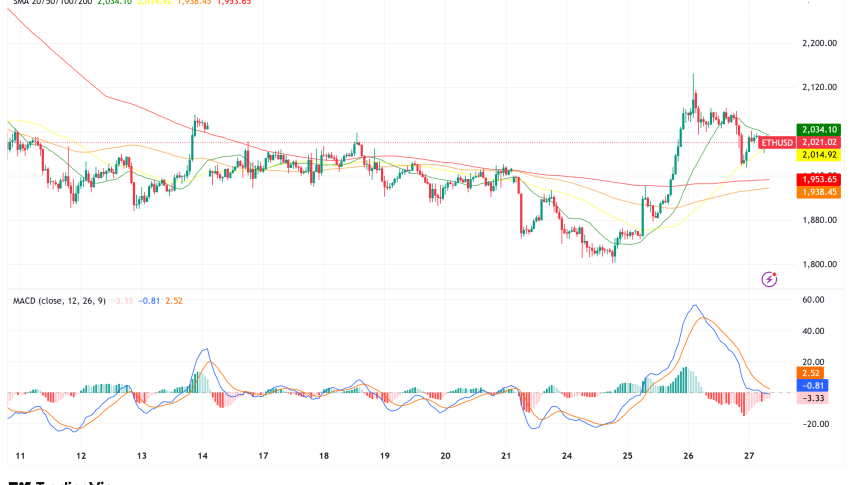
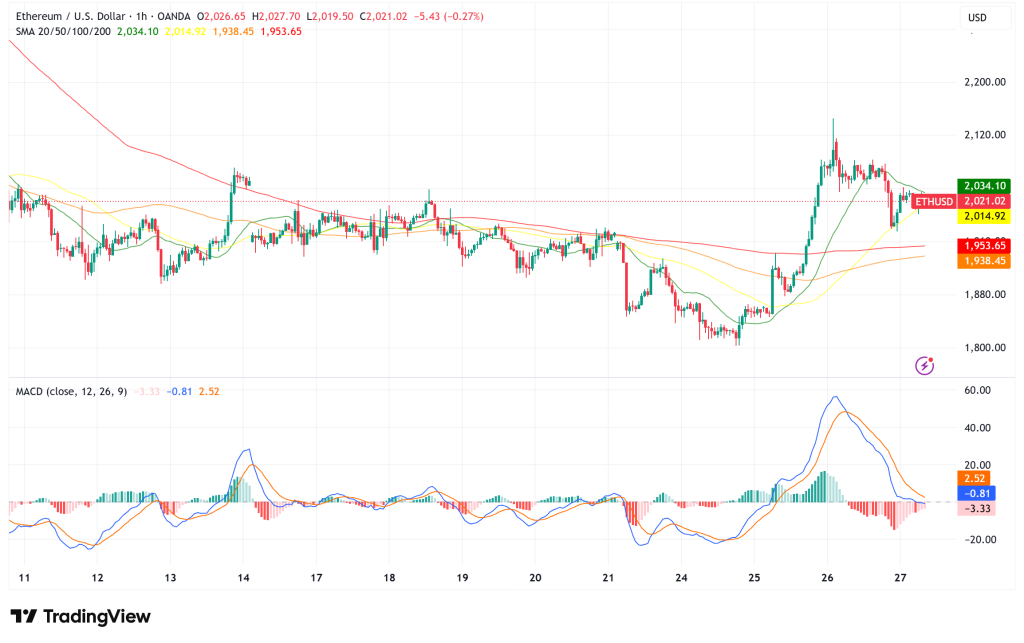
On the hourly chart, ETH is trading above $2,020 and the 100-hour Simple Moving Average, with both the MACD gaining momentum in bullish territory and the RSI holding above the 50 level. On the hourly timescale, a new negative trend line has emerged, with resistance located close to $2,040. A clear push above $2,080 is needed to shift short-term momentum decisively to the upside, with subsequent resistance targets at $2,120, $2,155, $2,220, and ultimately $2,250.
IncomeSharks, an analyst, points to a string of recurring SuperTrend rejections and a channel resistance close to $2,250 on the daily chart. With each attempted rally being sold into at the red band, the SuperTrend indicator, which defines dynamic trend direction using the Average True Range (ATR), has turned red above the current price. This indicates that on longer timescales, sellers maintain structural control.
CoinGlass data, on the other hand, indicates that there is a sizable liquidity pocket below current levels, with over $2.66 billion of cumulative long liquidation exposure grouped around $1,800. Over the last two days, short liquidations totaling $220 million were completed, which decreased some overhead leverage. However, with funding rates on Binance now flipping back into positive territory at 0.23%, positioning is tilting toward the long side — and an overcrowded long trade near current levels raises the risk of a fresh long squeeze if momentum stalls.
Ethereum Price Prediction: Three Scenarios Traders Should Watch
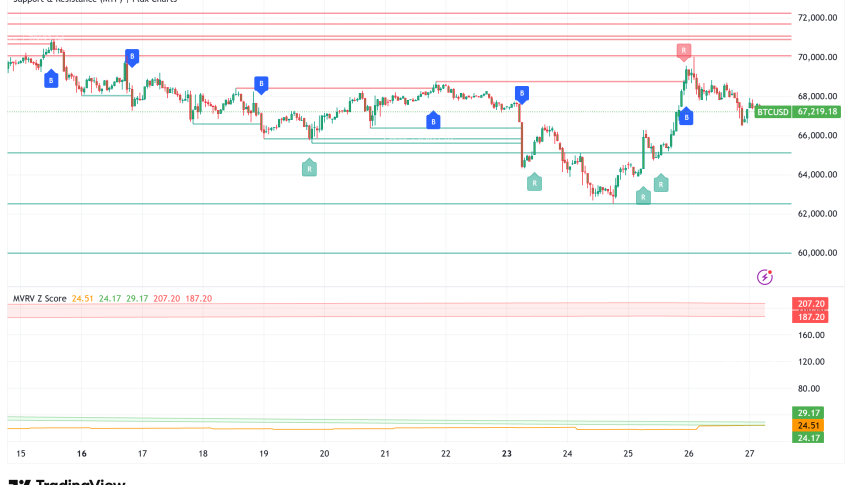
- Bullish scenario: Bulls can aim for a retest of $2,080, followed by $2,120 and $2,155, if ETH maintains the immediate $1,975 support and Bitcoin stabilizes over $67,000. Regaining the whale cost basis level with a daily closing over $2,120 may pave the way for a short-term move to $2,220–$2,250. IncomeSharks points out that any sustained advance over $2,500 is still a medium-term goal, but it probably necessitates a previous return to and successful defense of the April lows around $1,500.
- Bearish scenario: Failure to hold $1,975 on a closing basis puts the next major support at $1,935, followed by $1,900 and $1,880. A break below $1,850 would expose the $1,800 liquidity zone, where a cascade of long liquidations could accelerate the move lower. A weekly demand zone sits between $1,691 and $1,384, representing the deeper floor in a prolonged correction.
- Base case (neutral): The most likely short-term path is sideways consolidation between $1,950 and $2,100, with the final direction being determined by Bitcoin’s behavior around the $67,000 level. This is because ETH has been up 4.05% over the last seven days and the current decline seems to be a pullback within a short-term uptrend rather than a trend reversal.
- Check out our free forex signals
- Follow the top economic events on FX Leaders economic calendar
- Trade better, discover more Forex Trading Strategies
- Open a FREE Trading Account
- Read our latest reviews on: Avatrade, Exness, HFM and XM