Bitcoin Price Prediction: BTC Holds $70,690 Demand Zone as Ascending Channel Eyes $73,000 Retest
Quick overview
- Bitcoin is currently trading near $70,700, maintaining support above a key demand zone at $70,691.
- Technical indicators show mixed signals, with a bearish moving average crossover and active buyers near $71,378.
- Wider economic factors, including rising oil prices and inflation concerns, are complicating the market outlook.
- Institutional buying through spot Bitcoin ETFs has helped sustain prices above $70,000 despite market volatility.
On March 21, 2026, BITCOIN is trading near $70,700, staying above a key demand zone at $70,691 that has absorbed selling since late February. Bitcoin’s one-hour chart shows price holding the lower edge of an ascending channel from the $62,000 February low, while the upper edge meets resistance around $73,822, which has stopped every rally this month.
Bitcoin Technical Analysis – Chart Structure Points to a Decision Zone
The candlestick pattern between $69,112 and $71,378 shows that buyers are active, but sellers are still present, as seen by small candles with long upper wicks near $71,378. The 50-period moving average has dropped below the 200-period moving average near $71,198, a bearish sign that puts pressure on the bulls.
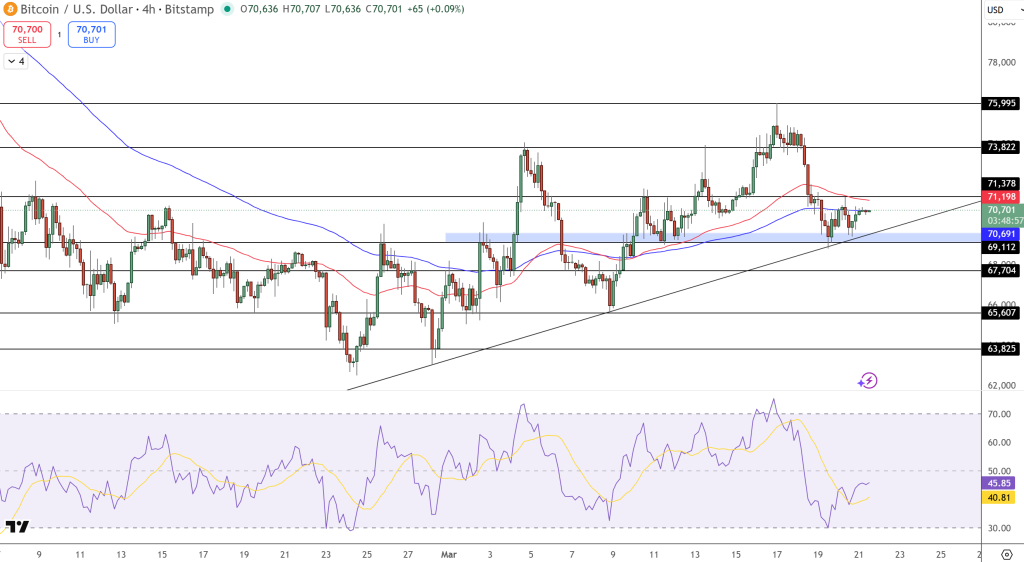
A Fibonacci retracement from the $62,000 February low to the $75,995 March high puts the 0.5 level near $69,000, matching the ascending trendline and helping explain why this area has held as support.
The Stochastic RSI is turning up from 40.81 to 45.85, suggesting that short-term selling is losing strength.
What Is Driving Bitcoin Price Today
Wider economic factors are making the technical outlook more complicated. Earlier this week, Bitcoin fell below $69,000 after the March 18 Fed meeting, where Chair Powell warned that rising oil prices from Middle East tensions could increase inflation.
This has lowered hopes for rate cuts in 2026. Ongoing conflict in the Strait of Hormuz has kept energy markets unstable and made investors more cautious.
Even so, Bitcoin has bounced back more quickly than stocks since the conflict worsened in late February, beating the S&P 500 by about 7% during the biggest market shocks.
Spot Bitcoin ETFs have helped support prices, with daily inflows of at least $155 million and multi-week totals around $1.47 billion. This steady institutional buying has helped keep Bitcoin above $70,000 despite the challenges.
Key Levels to Watch
Support at $70,691 remains the line in the sand. A break below opens $69,112 and then the Fibonacci confluence zone near $69,000. On the upside, $71,378 is the immediate hurdle, followed by the horizontal resistance wall at $73,822 that aligns with the channel ceiling.
A daily close above $75,995 would signal a structural shift in the broader trend.
Trade idea: Consider buying if there is a confirmed 4-hour close above $71,400. The target would be $73,822, with a stop loss set at $69,800.
- Check out our free forex signals
- Follow the top economic events on FX Leaders economic calendar
- Trade better, discover more Forex Trading Strategies
- Open a FREE Trading Account
- Read our latest reviews on: Avatrade, Exness, HFM and XM
Related Articles


Sidebar rates
Related Posts
