Gold Crashes 15% From Peak: Is $4,470 the Last Line of Defense Before a $4,200 Freefall?
Gold is trading around $4,495, a steep drop from its all-time high of $5,595.42 on January 29. Today, prices have ranged between $4,477...
Quick overview
- Gold has dropped over 15% from its all-time high, trading around $4,495 as of March 22, 2026.
- The ongoing Middle East conflict and rising oil prices are paradoxically putting downward pressure on gold prices due to higher inflation and interest rates.
- The Federal Reserve's decision to maintain interest rates has shifted market expectations, reducing hopes for rate cuts that could support gold prices.
- Key price levels to watch include the $4,472 Fibonacci support level, which will determine gold's short-term direction.
Gold’s recent behavior is surprising. Despite an ongoing war in the Middle East, rising oil prices, and climbing global inflation, gold has dropped more than 15% from its all-time high in just a few weeks. If you’re wondering why gold is falling when global risks are rising, you’re not alone. Understanding this will help you see where gold might go next.
What Is Gold Actually Doing Right Now
As of March 22, 2026, gold is trading around $4,495, a steep drop from its all-time high of $5,595.42 on January 29. Today, prices have ranged between $4,477.82 and $4,736.16, with the last close at $4,650.77.
Earlier in 2026, gold hovered above $5,000, but then it dropped about 6% over two days, falling below the key $5,000 mark and reaching around $4,700 by March 19, its lowest since early February. This sharp drop changed the chart outlook and brought several support levels into focus.
The Iran War Paradox: Why Gold Is Falling During a War
This is the main puzzle for the market right now. Usually, war, oil shocks, and volatility push traders toward gold for safety. But this time, gold is falling. Knowing why is crucial for making the right trading decisions.
The recent jump in oil prices from the Middle East conflict has made things harder for the Fed, with inflation staying above its 2% goal and the job market slowing. This mix is tough for gold in the short term. Higher oil prices raise inflation, so central banks keep interest rates high or even increase them. Higher rates make bonds and cash more appealing than gold, so investors move their money out of GOLD .
It’s ironic: gold is being sold during a Middle East conflict because the oil shock is actually hurting gold’s outlook. The spike in oil is pushing up inflation and making the Fed keep rates high. Higher oil leads to more inflation, higher rates for longer, and a stronger dollar, all of which put pressure on gold, even though the situation would normally help it.
Brent crude oil is now above $105 per barrel, and the US Dollar Index is over 104. The Fed is in a tough spot, facing a situation where both inflation and growth risks are rising at the same time.
The Fed Just Delivered a Brutal Hawkish Hold
At its March 19 meeting, the Federal Reserve dealt a final blow to gold investors who were hoping that rate cuts would support prices.
The Federal Open Market Committee voted 11-1 to keep the benchmark federal funds rate anchored in the range of 3.5% to 3.75%. Before the conflict, markets had been pricing in two rate reductions this year, but rising oil prices and firm inflation readings pushed expectations down to at most one cut in 2026.
Now, fourteen out of nineteen FOMC members expect either no rate cuts or just one this year, a big change from the multiple cuts expected at the end of 2025. For gold traders, it’s even more concerning that futures markets now see almost a 20% chance of a rate hike in June and no chance of a cut, according to the CME FedWatch tool.
Fed Chair Jerome Powell said that higher oil and gas prices will push inflation up in the short term, but it’s still too early to tell how the conflict will affect growth and jobs. This uncertainty is making gold prices volatile and keeping them under pressure for now.
The 10-year US Treasury real yield rose above its 50-day moving average to 1.87% and is heading toward resistance at 1.98%. Gold often moves in the opposite direction of long-term Treasury yields because it doesn’t pay interest. When real yields go up, holding gold becomes less attractive, so demand and prices fall.
The Technical Picture: Where Gold Must Hold or Break
Looking at the charts, the recent drop is serious but hasn’t ruined the long-term bullish outlook yet. Here’s what the key price levels show right now.
Gold is now testing the 0.618 Fibonacci retracement at $4,472, which lines up with the rising trendline from the $3,885 base. This is probably the most important support level on the chart.
The 200-day moving average, near $4,643, has turned from support into resistance, which is a bearish sign. The RSI is near 30, showing oversold conditions, but that doesn’t always mean the selling is over.
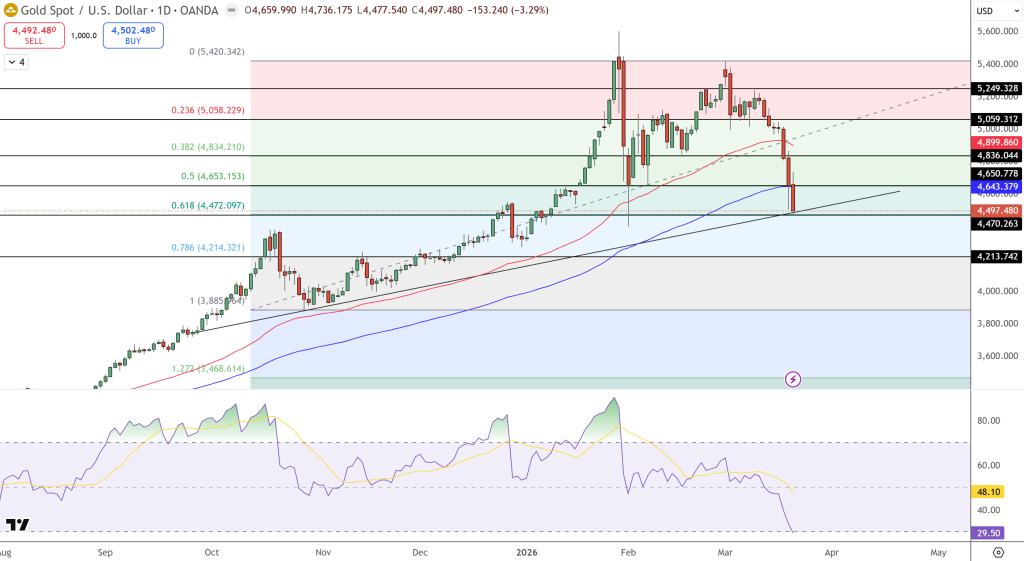
Here are the key scenarios to watch. If gold closes below $4,470, it would break both the Fibonacci level and the trendline, likely leading to a quick drop toward the next support zone around $4,214. If gold recovers and moves above $4,836, it could stabilize and push momentum back toward the $5,050 resistance area.
Important resistance levels for any bounce are $4,703 to $4,655 and $4,587 to $4,554, which are Fibonacci extension levels and the lower edge of the recent descending channel.
When gold fell below the 50-day moving average near $4,978 and the $5,000 mark, it triggered momentum selling and profit-taking from traders who had bet on higher prices. This is a typical pattern in a leveraged market. Those who bought gold up to $5,400 on the first war headlines are now being forced to sell as the bigger economic picture becomes clear.
Is This a Buying Opportunity or the Start of Something Worse
Every trader and investor is asking this question right now. The truth is, the short-term and long-term outlooks are very different, so your investment time frame is crucial.
Looking at the bearish side, the current macro environment is tough for gold in the short term. Morningstar expects PCE inflation to rise to 3.5% year-over-year by April, up from 2.8% in January, the highest since May 2023. Futures markets now expect only one rate cut in 2026, down from two before the war. As long as this situation continues, any gold rally will likely face selling pressure.
On the bullish side, the long-term fundamentals for gold are still strong. Central banks are still buying gold worldwide, countries are moving away from dollar assets, and debt levels in major economies remain high. JPMorgan analysts expect gold to recover to about $6,300 by the end of 2026, with even higher targets possible if the conflict drags on.
Gold prices are expected to see moderate gains in the next month, mainly driven by geopolitical uncertainty, the Middle East conflict, and hopes for central bank easing. However, a strong US dollar and high interest rates could limit how much gold rises.
Right now, the market is a tug of war between traders selling speculative positions and long-term buyers like central banks and physical gold investors picking up gold at lower prices. Premiums on physical gold coins and bars are still high, quietly showing that real demand remains steady.
What to Watch This Week
Several events could move gold sharply in either direction soon. News from the Middle East is the biggest unknown. If the conflict escalates near the Strait of Hormuz, oil prices could jump and, ironically, put more downward pressure on gold as the Fed stays focused on fighting inflation. On the other hand, any real sign of peace could send gold higher as inflation fears ease and hopes for rate cuts return.
The upcoming US Personal Consumption Expenditures Price Index report will be important for shaping market views on Fed policy, especially with worries about war-driven inflation. If the report shows higher-than-expected inflation, gold could fall below the key $4,470 level. If inflation is lower, gold might bounce back toward $4,700.
US preliminary PMI data is also coming out this week. If there are signs of weakness in services or manufacturing, it could raise worries about stagflation, making the Fed’s decisions and gold’s short-term direction even more complicated.
Bottom Line
Gold is stuck between a war that would normally push prices up and a policy environment that is pushing them down. The $4,472 Fibonacci level is the key to watch in the coming days. If gold stays above it, there’s a good chance for a recovery toward $4,836 or higher. If it falls below, $4,214 is likely the next stop before long-term buyers step in.
The long-term outlook for gold is still positive. In the short term, though, headlines, oil prices, and Fed statements are driving the market, and all are very uncertain.
Right now, managing your position size and risk is more important than betting on a direction. Keep a close eye on the $4,472 level—it could be one of the most important closes of the year for gold.
- Check out our free forex signals
- Follow the top economic events on FX Leaders economic calendar
- Trade better, discover more Forex Trading Strategies
- Open a FREE Trading Account
- Read our latest reviews on: Avatrade, Exness, HFM and XM
Related Articles
Sidebar rates
Related Posts
