AVGO Stock Risks Breakdown Below $300 If Support Fails, Despite Strong Chip Demand
Broadcom Inc. surged on strong chip-driven demand, but fading momentum now puts the $300 support level in focus.
Quick overview
- Broadcom Inc. experienced a surge in demand but is now facing a critical $300 support level after failing to break the $350 resistance.
- The company is strengthening its position in AI infrastructure through partnerships with major firms like Google, Microsoft, and OpenAI.
- Despite strong earnings with a 29% revenue increase, technical momentum is weakening, raising concerns about future performance.
- Analysts remain optimistic, with Rosenblatt Securities raising its price target to $500, reflecting confidence in long-term growth.
Broadcom Inc. surged on strong chip-driven demand, but fading momentum now puts the $300 support level in focus.
Rally Fades at Key Resistance
Shares of Broadcom Inc. jumped following strong earnings but failed to break above the key $350 resistance level. The rejection has led to a steady pullback, with the stock now drifting toward the $300 support zone.
This level is critical for near-term direction. A break below it could trigger further downside, highlighting the growing divergence between strong fundamentals and weakening technical momentum.
Partnerships Strengthen Strategic Position
Broadcom continues to expand its role in AI infrastructure through high-profile partnerships. The company collaborates with major technology firms such as Google and Microsoft, and has now added OpenAI to its ecosystem.
The OpenAI agreement includes a multiyear plan to develop custom AI accelerators, marking a potential shift away from reliance on NVIDIA’s general-purpose GPUs.
Innovation and Analyst Support
At the Optical Fiber Communication Conference and Exhibition 2026, Broadcom showcased next-generation AI networking technologies, strengthening its competitive positioning.
Meanwhile, Rosenblatt Securities raised its price target to $500, reflecting confidence in long-term AI-driven growth.
Technical Analysis – The Lower Highs Continue
Broadcom entered the new year on uncertain footing, with its share price dipping below $300 as confidence across the AI semiconductor complex began to fray. After months of near-uninterrupted gains, investors have turned more defensive, questioning how much of the AI is already priced into leading infrastructure names.
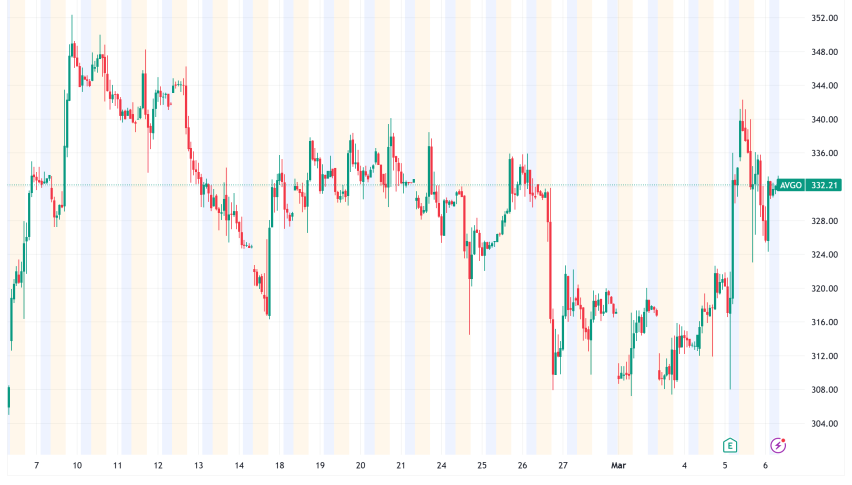
AVGO Chart Daily – The Support Is Under Attack

The bearish momentum continued and AVGO shares fell last month, threatening to break the 200-day simple moving average (purple) which has acted as support before. However the 100 SMA (red) held as support and we saw a strong rebound after the earnings last week, taking the stock to $350. But moving averages continue to reject the price and we saw a reversal lower last week and this week the decline continues, despite the improved sentiment, so AVGO stock is heading to the support zone at $308 again and it might fall under $300 if that support zone breaks.
Strong Earnings and Growth Outlook
Broadcom reported solid first-quarter results, with revenue rising 29% year-over-year. The semiconductor segment led growth, with revenue up 52% as demand for advanced chips and networking solutions accelerated.
Chip revenue reached $8.4 billion, driven by hyperscale data center investment in AI infrastructure. CEO Hock Tan expects AI semiconductor revenue to climb further next quarter, reinforcing a strong growth trajectory.
Broadcom Q1 FY2026 Results: Strong Growth Across Revenue, Profit and Cash Flow
🔹 GAAP Financial Highlights (Q1 FY2026 vs Q1 FY2025)
Net Revenue:
- $19.31 billion vs $14.92 billion
- +29% year-over-year
Net Income:
- $7.35 billion vs $5.50 billion
- +34% YoY
Diluted EPS:
- $1.50 vs $1.14
- +32% YoY
🔹 Non-GAAP Financial Highlights
Net Revenue:
- $19.31 billion (same as GAAP)
- +29% YoY
Net Income:
- $10.19 billion vs $7.82 billion
- +30% YoY
Diluted EPS:
- $2.05 vs $1.60
- +28% YoY
🔹 Cash Flow & Profitability Metrics
Cash Flow from Operations:
- $8.26 billion vs $6.11 billion
- +35% YoY
Adjusted EBITDA:
- $13.13 billion vs $10.08 billion
- +30% YoY
Free Cash Flow:
- $8.01 billion vs $6.01 billion
- +33% YoY
Capital Expenditures:
- $250 million during the quarter
Quarter-End Cash & Equivalents:
- $14.17 billion (down from $16.18 billion in prior quarter)
🔹 Revenue Breakdown by Segment
Semiconductor Solutions
- $12.52 billion (65% of total revenue)
- $8.21 billion in Q1 FY2025 (55% of total)
- +52% YoY growth
- Major driver of overall revenue expansion
Infrastructure Software
- $6.80 billion (35% of total revenue)
- $6.70 billion in Q1 FY2025 (45% of total)
- +1% YoY growth
- Stable but slower growth compared to semiconductor division
🔹 Shareholder Returns
- Quarterly dividend paid: $0.65 per share
- Total dividend payout: $3.09 billion
- Payment date: December 31, 2025
📊 Q2 FY2026 Outlook (Ending May 3, 2026)
- Revenue Guidance: Approximately $22.0 billion
- Adjusted EBITDA Margin Guidance: Around 68% of projected revenue
Outlook: Support Level in Focus
Despite strong fundamentals, market sentiment has turned more cautious. If the $300 level holds, Broadcom may stabilize. However, a breakdown could signal deeper consolidation as investors reassess valuations after a strong run.
- Check out our free forex signals
- Follow the top economic events on FX Leaders economic calendar
- Trade better, discover more Forex Trading Strategies
- Open a FREE Trading Account
- Read our latest reviews on: Avatrade, Exness, HFM and XM
Related Articles
Sidebar rates
Related Posts
