GameStop Stock (GME) Chart Analysis: Key Levels & Short-Term Bearish Outlook

Quick overview
- GameStop (GME) has shown a short-term rebound from its golden ratio support at $19.5, but remains in a broader bearish trend.
- The stock faces critical resistance levels at the 50-month EMA ($22.8) and the 0.382 Fibonacci level ($26.2), which must be reclaimed for a bullish reversal.
- Recent technical indicators, including death crosses on the daily and 4-hour charts, suggest a prevailing bearish momentum.
- If GME fails to hold the $19.5 support, it could see further declines toward the 200-month EMA at $15.4.
GameStop stock (GME) has staged a constructive short-term rebound, exhibiting a bullish reaction off recent lows. However, this move must be viewed within the broader context of a prevailing macro downtrend, characterized by a sequence of lower highs and lower lows on higher timeframes.
The key question now is whether this bounce represents the early stages of a meaningful trend reversal, or merely a relief rally within an established bearish structure. For sustained upside to materialize, GME would need to reclaim critical resistance levels, break its downtrend structure, and confirm strength through expanding volume and continued higher highs.
Absent these confirmations, the current price action leans toward a corrective bounce rather than a structural shift—leaving the path of least resistance tilted to the downside.
GameStop Stock Bounces Off Fibonacci Support but Encounters Strong Rejection at Key Resistance
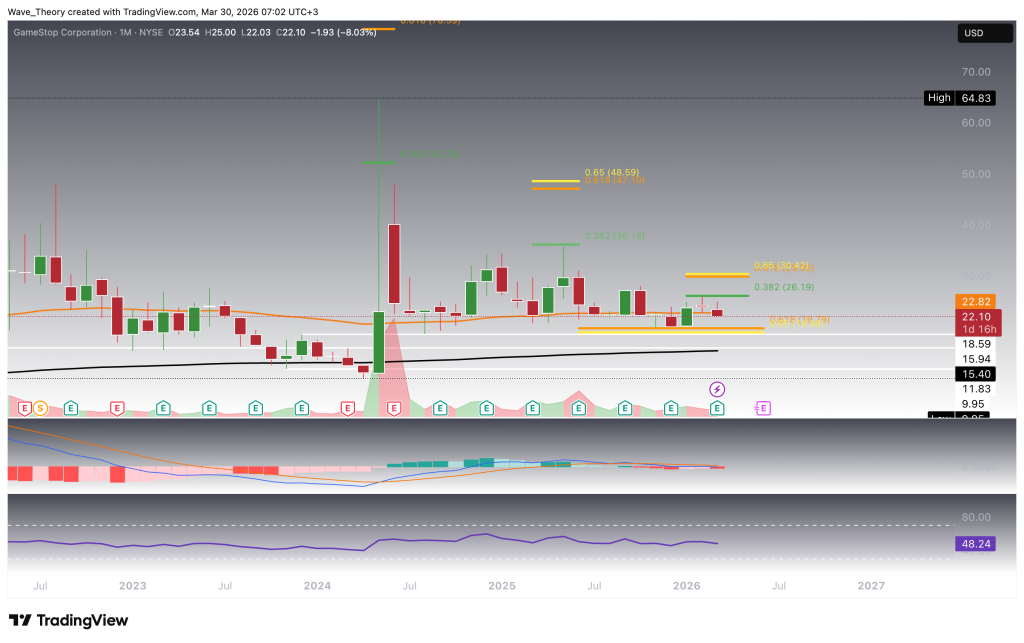
GameStop (GME) recently delivered a technically constructive bounce off its golden ratio (0.618 Fib) support at $19.5, following an extended downtrend that began after its summer 2024 peak near $65. This rebound marked a notable shift in short-term momentum, allowing price to reclaim the 50-month EMA at $22.8—a level that had previously acted as dynamic resistance. Building on this strength, GME advanced toward the 0.382 Fibonacci resistance at $26.2, where it encountered a sharp and decisive rejection, signaling persistent overhead supply.
In the wake of this rejection, price action now appears vulnerable to a bearish breakdown below the 50-month EMA at $22.8, which has flipped back into a critical support level. A confirmed loss of this level would likely expose a retest of the $19.5 golden ratio support. Should this key structural floor fail to hold, downside risk could accelerate toward the 200-month EMA at $15.4, marking the next major long-term support zone.
From an indicator standpoint, the monthly chart reflects a mixed but increasingly cautious outlook. While the EMAs continue to exhibit a golden crossover—typically indicative of a sustained bullish long-term trend—the momentum profile is deteriorating. The MACD lines have crossed bearishly, accompanied by a declining histogram, suggesting weakening upside momentum. Meanwhile, the RSI remains neutral, offering no clear directional bias at present.
GameStop Previously Surged Approximately 30% but Faces Critical Resistance to Sustain Momentum
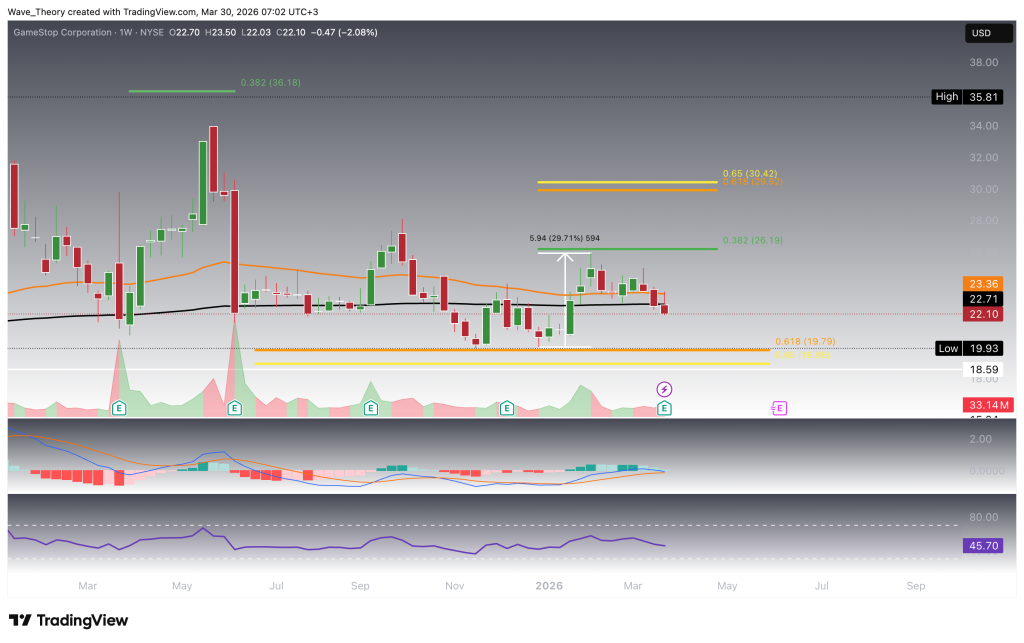
GameStop (GME) previously rallied roughly 30% following its bullish reaction off the golden ratio (0.618 Fib) support at $19.5, demonstrating strong short-term recovery momentum. However, despite this advance, the broader corrective structure remains intact as long as price fails to decisively break above the 0.382 Fibonacci resistance at $26.2 and the golden ratio resistance at $30. Until these levels are reclaimed, the prevailing trend continues to favor a bearish continuation scenario.
On the weekly timeframe, momentum indicators are beginning to deteriorate. The MACD lines are on the verge of a bearish crossover, while the MACD histogram has been ticking lower for the past three consecutive weeks—both signaling a loss of bullish momentum. In contrast, the RSI remains neutral, providing no strong directional conviction. Meanwhile, the EMAs continue to display a golden crossover, which supports a bullish bias in the mid-term trend despite the emerging short-term weakness.
Death Cross Emerges on the Daily Chart, Reinforcing Short-Term Bearish Bias
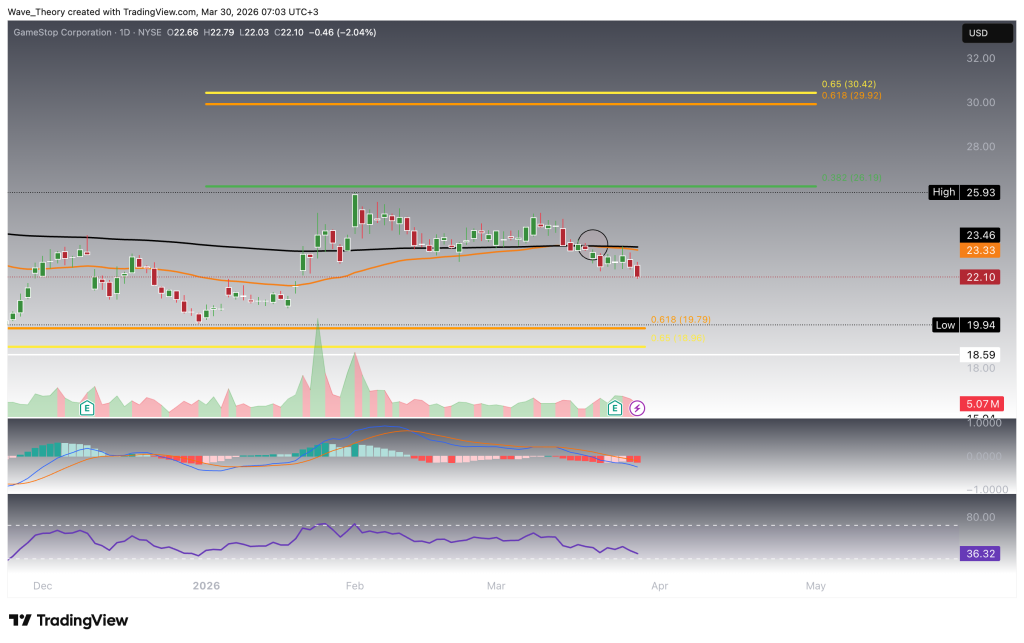
On the daily timeframe, GameStop (GME) has now formed a confirmed death cross, with the shorter-term EMAs crossing below the longer-term EMAs—solidifying a bearish trend structure in the near term. In line with this development, price action appears increasingly likely to rotate back toward the golden ratio (0.618 Fib) support at $19.5.
Momentum indicators further support this downside scenario. The MACD lines are bearishly crossed, while the MACD histogram has begun to tick lower again since yesterday, signaling accelerating bearish momentum. Meanwhile, the RSI continues to hover in neutral territory, offering no immediate divergence or reversal signal.
Should GME revisit the $19.5 golden ratio support, a bullish reaction remains plausible given prior price behavior at this level. A successful bounce could see price reattempt a move toward the 0.382 Fibonacci resistance at $26.2. A confirmed breakout above this resistance would then open the path toward the next key level at the golden ratio resistance of $30.
GameStop (GME) Technical Summary and Key Levels
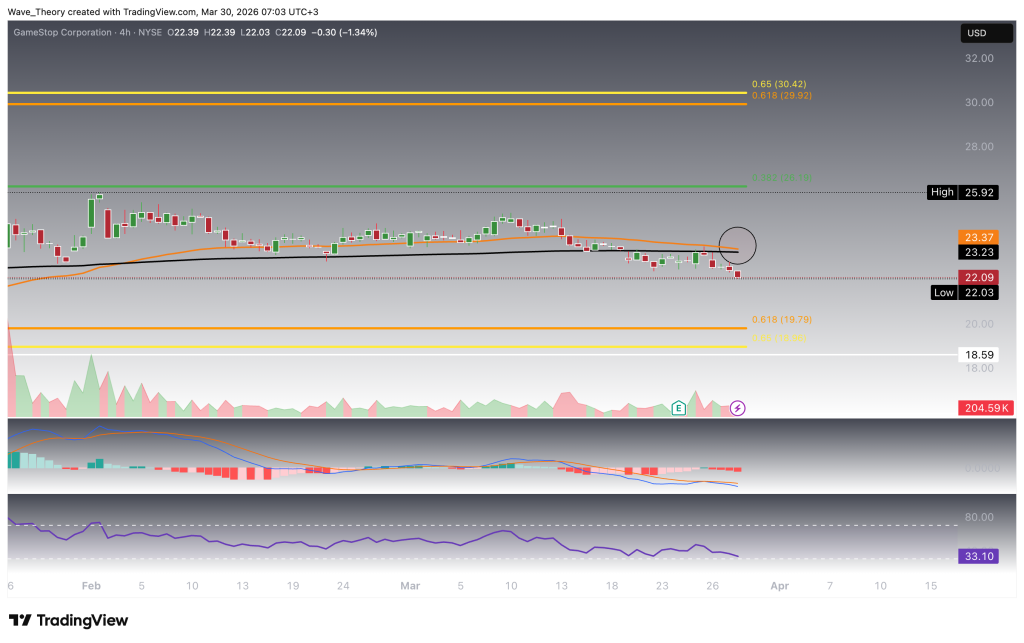
GameStop has experienced a short-term rebound from the golden ratio support at $19.5, previously surging ~30%, but overall remains in a broader bearish structure across multiple timeframes. Key resistance levels include the 50-month EMA at $22.8, 0.382 Fib at $26.2, and the golden ratio at $30. Short-term charts (daily and 4H) show death crosses and bearish MACD signals, indicating momentum favors downside.
Key Support Levels:
- Golden ratio: $19.5
- 200-month EMA: $15.4
Key Resistance Levels:
- 50-month EMA: $22.8
- 0.382 Fib: $26.2
- Golden ratio: $30
Indicator Snapshot:
- Monthly EMAs: bullish golden crossover
- Weekly MACD: approaching bearish cross
- Daily/4H EMAs: death cross, short-term bearish
- RSI: neutral to oversold
Outlook:
Short-term momentum remains bearish, with potential retests of $19.5. A confirmed break above $26.2 would be required to shift the trend toward a bullish recovery.
- Check out our free forex signals
- Follow the top economic events on FX Leaders economic calendar
- Trade better, discover more Forex Trading Strategies
- Open a FREE Trading Account
- Read our latest reviews on: Avatrade, Exness, HFM and XM
Related Articles
Sidebar rates
