Silver Prices Up 945% Since COVID: A Historic Precious Metals Rally
Quick overview
- Silver has surged approximately 945% since its 2020 low, reaching an all-time high of $121.65 before retracing nearly 50%.
- Despite recent volatility, the long-term trend remains bullish, supported by golden cross patterns in the monthly EMAs and MACD lines.
- Key support levels to watch include the 50-week EMA at $59.5 and the 200-day EMA at $62.5, while resistance levels are at $78.5 and $84.2.
- Short-term momentum indicators show mixed signals, with bearish trends on daily and 4-hour charts, suggesting potential for further corrective moves.
Silver Price Reaches New All-Time High at $121.65 Before Halving in Value
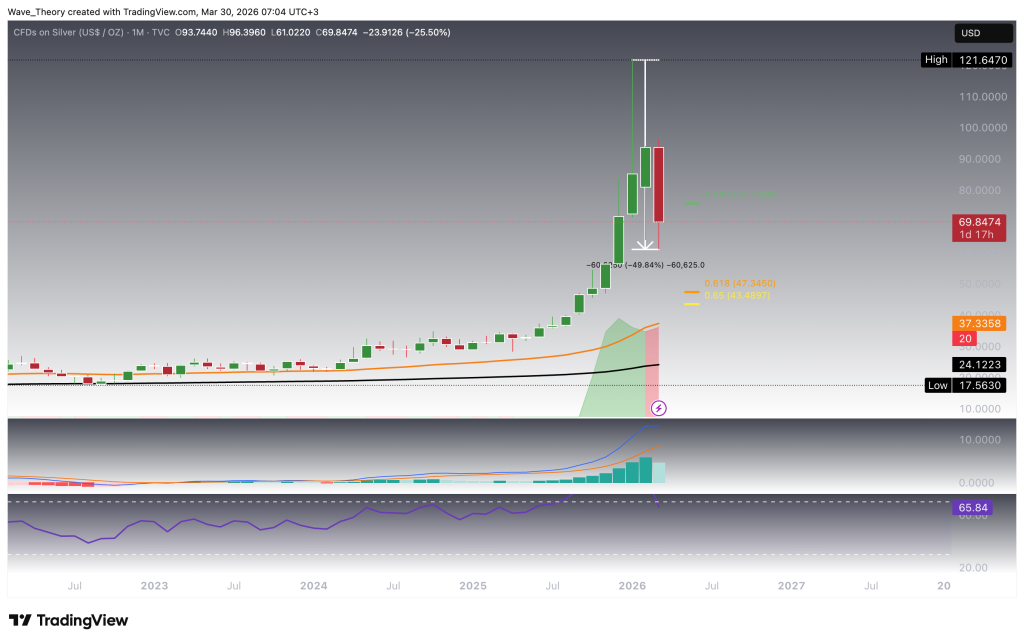
Silver recently surged to an all-time high of approximately $121.65 in January, only to enter a sharp corrective phase. Since then, the metal has halved in price, dropping roughly 50% and decisively breaking through the 0.382 Fibonacci support at $75.8. This pullback has prompted the MACD histogram to tick bearishly lower this month, while the RSI has retreated from overbought levels to neutral territory, signaling a loss of short-term bullish momentum.
On the long-term side, the monthly EMAs remain in a golden crossover, confirming that the broader trend remains fundamentally bullish. Additionally, the MACD lines continue to hold a bullish cross, supporting the overall uptrend despite recent weakness.
However, with the break of the $75.8 Fib support, silver could now extend its corrective move toward the golden ratio support near $45, where a potential bullish reaction may emerge. As long as this critical support zone holds, the long-term uptrend remains structurally intact.
Will Silver Bounce Bullishly Off the 50-Week EMA Support?
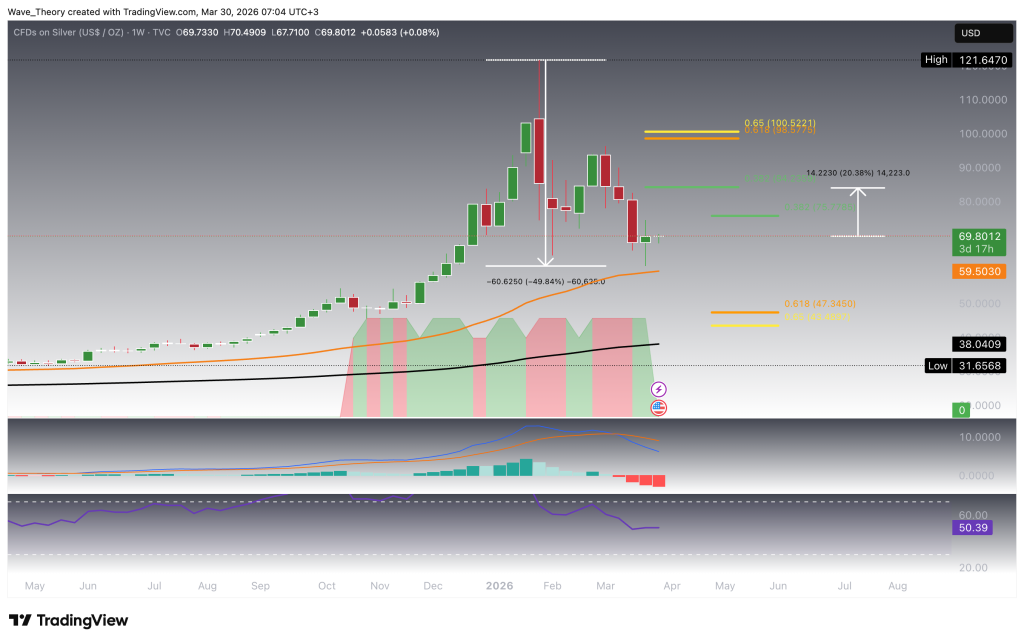
Over the past nine weeks, Silver has been in a corrective phase, approaching significant support at the 50-week EMA around $59.5. If a bullish reversal emerges from this level, the metal’s next key Fibonacci resistances lie at $84.2 and $100. A break above the 0.382 Fib resistance would open the path toward the golden ratio at $100, signaling a potential end to the correction. A move to the first Fib resistance at $84 would imply an upside of roughly 20%.
From a technical standpoint, the EMAs remain in a golden crossover, reinforcing a bullish mid-term trend. However, momentum indicators show caution: the MACD lines are bearishly crossed, and the MACD histogram is trending lower, while the RSI remains neutral, reflecting uncertainty in short-term momentum.
Can Silver Hold Above the 200-Day EMA?
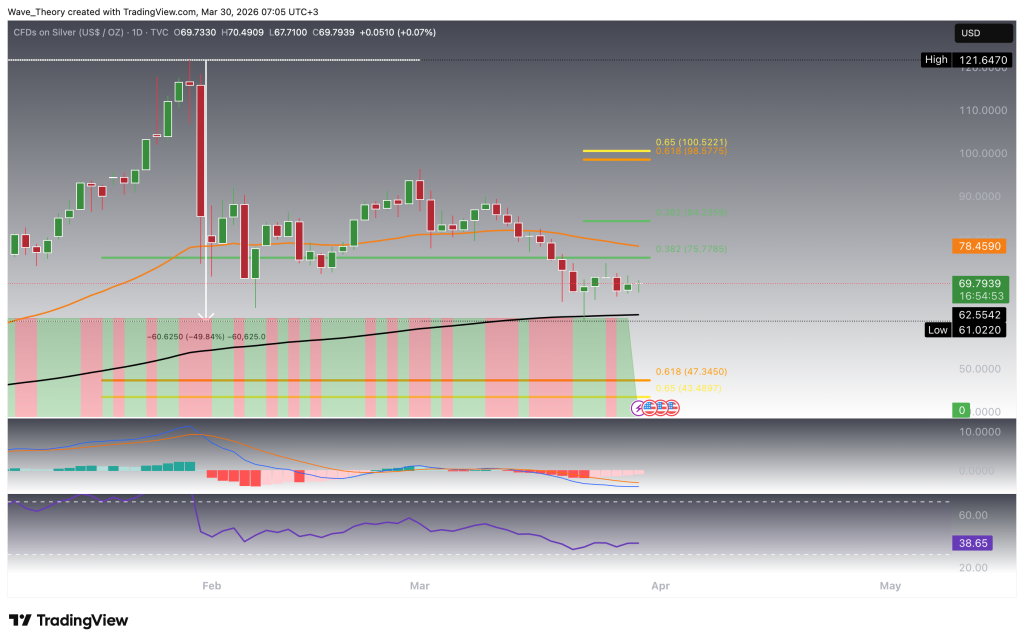
On the daily chart, Silver’s EMAs continue to display a golden crossover, reaffirming a bullish bias in the short- to medium-term. The MACD histogram has been ticking higher over the past few days, with the MACD lines approaching a potential bullish cross, signaling improving upward momentum. Meanwhile, the RSI remains neutral, indicating no immediate overbought or oversold pressure.
Currently, Silver finds critical support at the 200-day EMA around $62.5, while the 50-day EMA near $78.5 represents the next significant resistance level. Maintaining above the 200-day EMA is essential for sustaining the short-term bullish structure and preventing a deeper correction.
SILVER
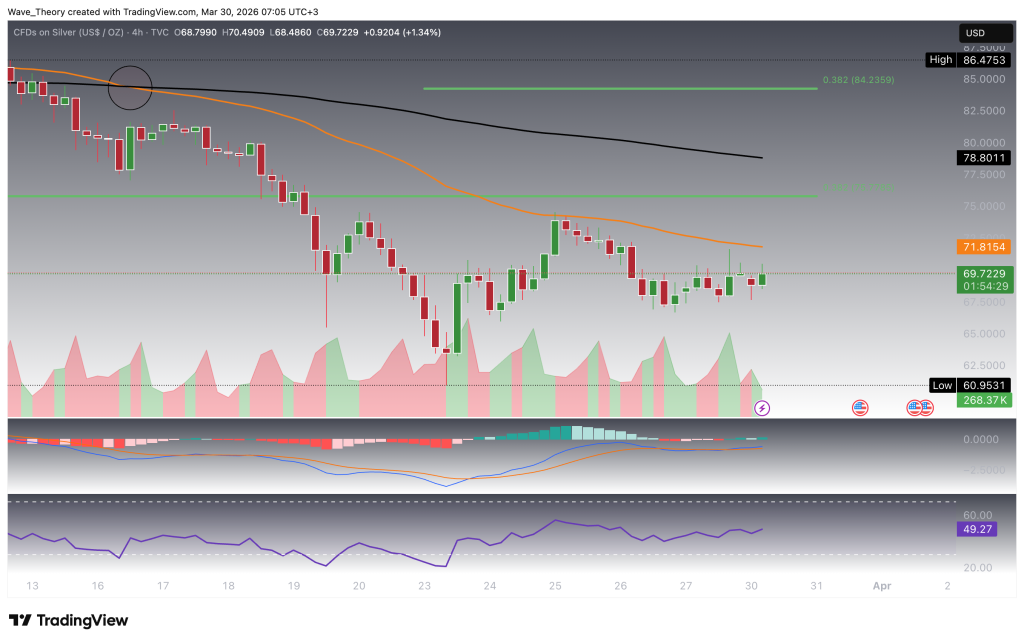
Silver Faces Rejection at the 50-4H EMA Resistance
On the 4-hour chart, Silver has established a death cross, confirming a short-term bearish trend. Recently, the metal faced rejection at the 50-4H EMA near $71.8, a level it could potentially retest in the near term.
Despite the short-term bearish structure, momentum indicators show some bullish signs: the MACD lines are crossed bullishly, and the MACD histogram is ticking higher, suggesting potential upside pressure. The RSI remains neutral, offering no strong directional bias at this time. Overall, Silver remains at a critical juncture, balancing between short-term resistance and potential bullish momentum.
Silver — Short Summary & Key Levels
Silver has experienced an extraordinary rally from its 2020 lows, reaching an all-time high of $121.65 before retracing roughly 50%. The metal remains in a long-term bullish structure, supported by monthly EMAs in a golden crossover and MACD lines bullishly crossed, but short-term momentum is mixed, with daily and 4H charts showing death crosses and MACD histograms trending bearishly.
Key Support Levels:
- 50-week EMA: $59.5
- 200-day EMA: $62.5
- Golden ratio (monthly): $45
Key Resistance Levels:
- 50-day EMA: $78.5
- 0.382 Fib: $84.2
- Golden ratio (monthly): $100
- All-time high: $121.65
Outlook:
- Short-term: Bearish pressure dominates; Silver may retest the 50-week or 200-day EMA support.
- Mid- to long-term: Trend remains fundamentally bullish; a break above $84.2 and eventually $100 would confirm the correction phase is over.
- Check out our free forex signals
- Follow the top economic events on FX Leaders economic calendar
- Trade better, discover more Forex Trading Strategies
- Open a FREE Trading Account
- Read our latest reviews on: Avatrade, Exness, HFM and XM
Related Articles
Sidebar rates
