Gold Price Analysis: Powell’s “Well-Anchored” Signal Builds a $4,550 Floor – Can XAU/USD Reach $4,670 on the Monthly Close?
Gold (XAU/USD) is trading at $4,550 to $4,560 on March 31, 2026, steadying after its worst monthly drop since 2008...
Quick overview
- Gold (XAU/USD) is currently trading between $4,550 and $4,560, stabilizing after a significant drop in March.
- Federal Reserve Chair Powell's comments on inflation have eased yield pressure, contributing to gold's recovery from a low of $4,370.
- A monthly close above $4,500 could indicate a bullish reversal, while central bank buying remains a key long-term support for gold prices.
- Analysts predict gold could reach between $5,155 and $6,300 by year-end, depending on market conditions and central bank activity.
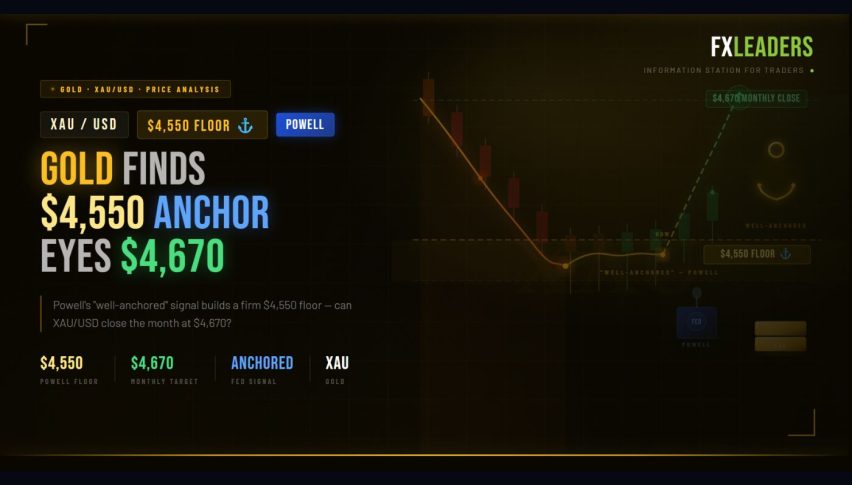
Gold (XAU/USD) is trading at $4,550 to $4,560 on March 31, 2026, steadying after its worst monthly drop since 2008. The Fed’s recent comments have eased yield pressure on gold, helping it hold above $4,500. Today’s monthly close could mark a reversal and set the tone for the second quarter.
What Changed: Powell’s Inflation Signal Gave Gold Its Floor
The key change this week was Powell describing inflation as “well-anchored,” which separated energy-driven price pressures from core rate expectations. This pushed the 10-year Treasury yield down to 4.32%, making it less costly to hold gold and slowing the dollar’s sharp rise.
The impact was quick. Gold attracted buyers at $4,370, which is the 0.236 Fibonacci level, and has since climbed 4% to the current $4,550 to $4,560 range. FXStreet data shows gold is continuing Friday’s gains, trading closer to $4,600 as lower Treasury yields and concerns about the Middle East help support prices.
It’s important to note that gold dropped 14% from its January peak of $5,200, marking its worst monthly loss since 2008. March is ending in the $4,500s instead of the feared $4,100 level, which shows a shift in the market’s tone.
XAU/USD Technical Analysis: The $4,670 Fibonacci Target
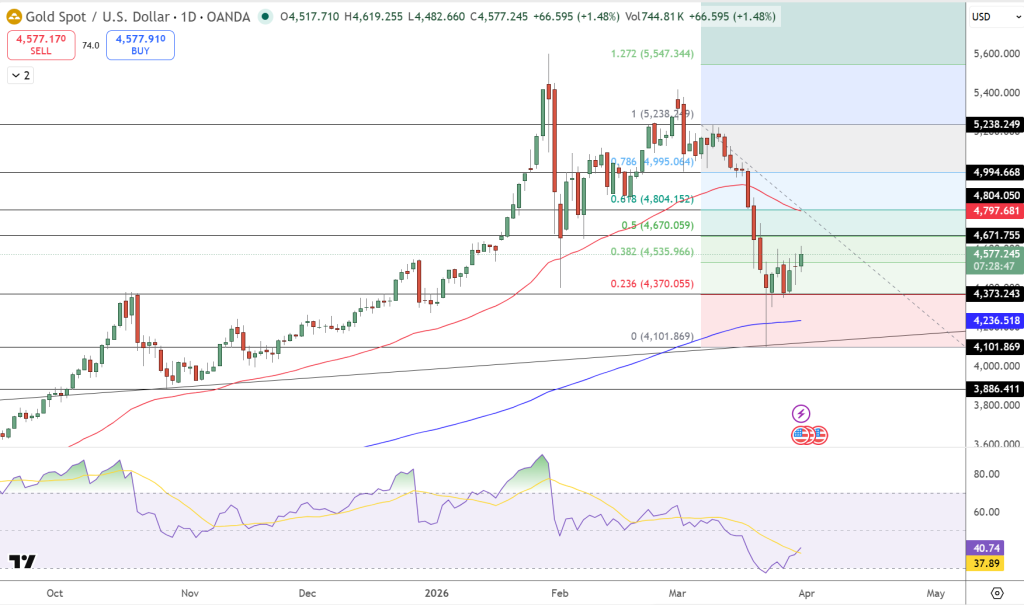
The 4-hour and daily charts show gold is recovering after breaking down from its main upward trend.
Key levels:
Support: $4,370 (0.236 Fibonacci / confirmed floor) → $4,101 (long-term trendline and 100-day MA confluence)
Resistance: $4,570 (current battleground) → $4,670 (0.5 Fibonacci — the decisive recovery target) → $4,790 (50-day MA, sloping downward)
RSI has risen from 35 to about 42, so the oversold conditions from mid-March are gone. However, a true reversal needs gold to move back above $4,670. Some analysts are watching for a possible Gartley pattern to finish: if gold closes above $4,600 (the 38.2% retracement), it could target $5,040 in the medium term, recovering over half of March’s losses.
Today’s monthly candle is important. If gold closes Tuesday above $4,500 with a lower wick, it will form a hammer or bullish reversal candle on the monthly chart. This pattern has often come before multi-week recoveries in the past.
Trade idea (long): Buy between $4,520 and $4,550, target $4,670, and set a stop below $4,370.
The Structural Bid That Won’t Go Away
Central bank buying is still the main long-term support for gold. The World Gold Council expects emerging market central banks to buy 850 tonnes in 2026, with India, China, and Kazakhstan leading the way. This steady buying has kept gold from closing below $4,370 during the recent correction.
Goldman Sachs still expects gold to reach $5,400 by year-end. JP Morgan forecasts $6,300 by year-end, and UBS sees $6,200 by mid-2026. Most analysts expect prices between $5,155 and $5,515, which is 15 to 25% higher than today’s price if market conditions improve in the second quarter.
FAQ: Gold Monthly Close, Powell Signal, and Q2 Outlook
Why is gold recovering at the end of March?
Powell’s message that inflation is still “well-anchored,” even with the oil shock, pushed the 10-year Treasury yield down from above 4.4% to around 4.32%. Lower real yields make it less costly to hold gold, which helped prices bounce from the $4,370 Fibonacci support.
Why does today’s monthly close matter for gold?
March’s candle shows a 14% drop, the worst since 2008. If gold closes above $4,500 with a lower wick (a hammer pattern), it would signal that selling is exhausted and could lead to a multi-week recovery. But a close below $4,370 would point to more downside toward $4,101.
What is the gold price target for the second quarter of 2026?
The next technical target is $4,670 (the 0.5 Fibonacci level). If the Gartley pattern completes above $4,600, gold could reach $5,040, recovering half of March’s losses. Goldman Sachs still targets $5,400 by year-end, JP Morgan sees $6,300, and the outlook depends on central banks keeping up their buying and Treasury yields staying lower.
- Check out our free forex signals
- Follow the top economic events on FX Leaders economic calendar
- Trade better, discover more Forex Trading Strategies
- Open a FREE Trading Account
- Read our latest reviews on: Avatrade, Exness, HFM and XM
Related Articles

Sidebar rates
Related Posts
