Ethereum Rebounds 6% as Whales Accumulate and Bulls Eye $2,388, But Derivatives Signal Caution
Ethereum has experienced a significant surge, rising more than 5.9% in the last day to trade between $2,200 and $2,240, recovering from a
Quick overview
- Ethereum has surged over 5.9% in the last day, recovering from a low of $2,059 earlier this week.
- Large wallets have accumulated nearly 230,000 ETH, indicating a decrease in supply pressure that favors short-term price movement.
- Key support is at $2,165, while a significant resistance level is at $2,380, which could signal a larger bullish trend if breached.
- Despite bullish momentum, the derivatives market shows caution with a decrease in open interest and potential risks from trapped short positions.
Ethereum ETH/USD has experienced a significant surge, rising more than 5.9% in the last day to trade between $2,200 and $2,240, recovering from a swing low of $2,059 earlier this week. Large holdings have taken notice of the shift.
Over the last seven days, wallets with 10,000–100,000 ETH added almost 230,000 ETH to their total holdings, reversing a brief distribution phase from the previous week. In contrast to the significant selling saw in January and February, retail cohorts (wallets containing 100–10,000 ETH) were largely stable. When taken as a whole, these dynamics point to a significant decrease in spot-market supply pressure, which is favorable for the short-term price movement.
ETH/USD Technical Structure: Broken Triangle, Recovered EMAs
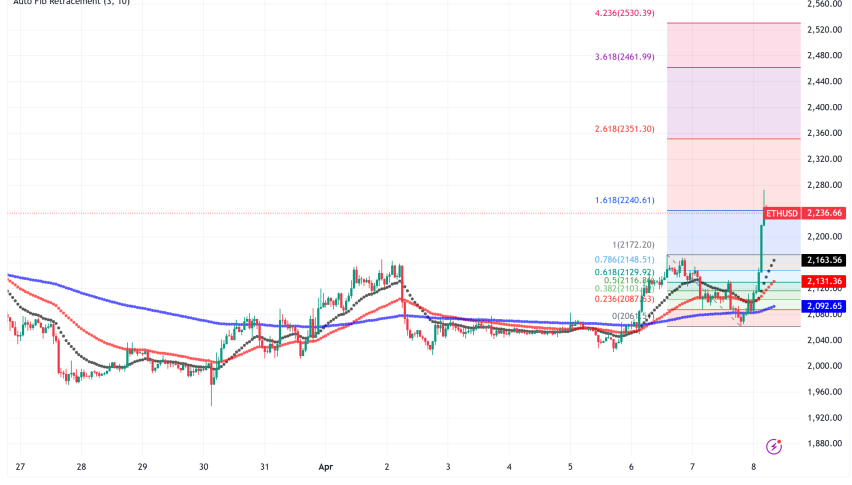
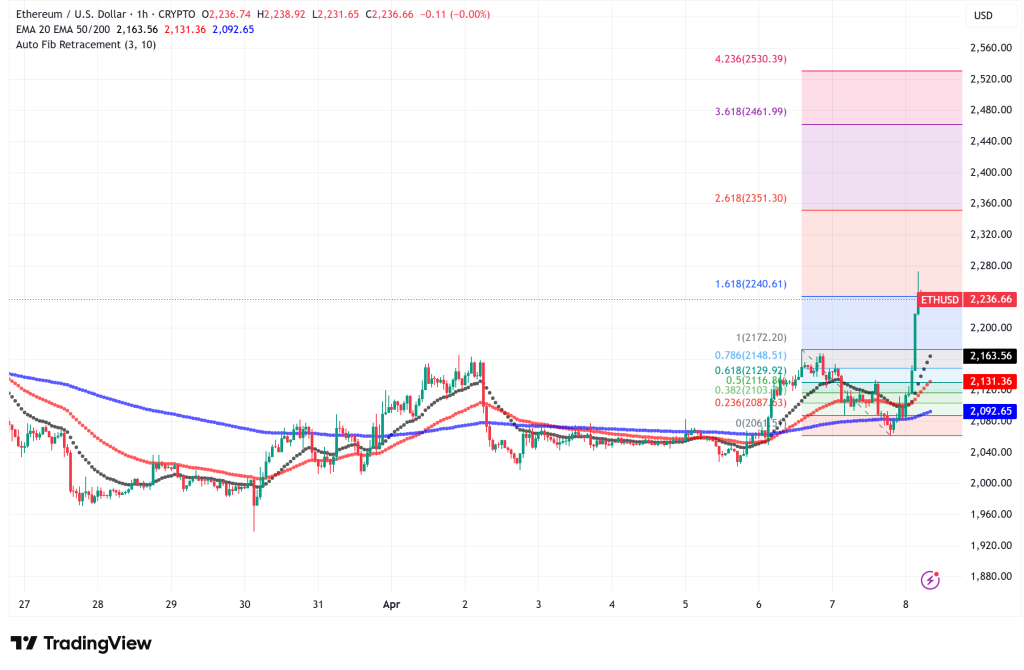
The hourly chart presents a clear narrative. ETH climbed to a local high of $2,273 after breaking above a contracting triangle with resistance at $2,150. Since then, it has retreated to consolidate above $2,180, which is significantly above the 100-hour simple moving average. The price has closed above the 50-day EMA (around $2,145–$2,150) on the daily chart, which had limited rallies for the most of the previous corrective session.
According to Fibonacci analysis, the $2,059–$2,273 move’s 23.6% retracement is close to the $2,165 zone, which is currently in line with the 50% retracement and acts as the main near-term floor. The daily MACD line is expanding above its signal line, and the hourly and daily RSI have also returned above 50, indicating that buyers are still in control for the time being.
Key Levels to Watch: $2,165 Below, $2,380 Above
From this point on, the organization is rather clear. The first significant defense on the downside is $2,165; a breach would reveal $2,120 and then the swing-low area between $2,059 and $2,065. The short-term bias would turn back toward bears if a clean daily close fell below $2,108, which is slightly below the 20-day EMA. In that case, the lower-level targets would be $1,911 and $1,741.
On the upside, $2,250 is the immediate barrier, followed by $2,275–$2,320. The 38.2% Fibonacci retracement of the wider $3,402–$1,747 decrease converges with a recent horizontal response high and the declining 100-day EMA at the key level of $2,380–$2,388. A significant indication that the larger corrective structure is being contested would be a daily close above this range, which would pave the way for the 50% retracement at $2,575 and, in a longer recovery, $2,746.
Derivatives Cool Off After Leveraged Run-Up
A warning is added by the derivatives market. Even though market prices remained range-bound, Ethereum’s projected leverage ratio increased significantly from about 0.70 in February to 0.93 by early April. Since then, open interest has decreased from 14.67 million ETH on March 28 to roughly 13.6 million ETH, indicating that part of that leverage is being exposed.
The price increase was fueled by the $114.6 million in futures liquidations over the last day, of which $90.6 million came from short positions. However, this raises the question of how much new money is coming vs how much is just trapped shorts being squeezed. Although the weekly slowdown in derivatives activity is worth monitoring, Net Taker Volume has been trending upward since early March, suggesting a slight bullish tilt among futures participants.
Ethereum Price Prediction: Bulls Have the Edge, but Conviction Requires $2,388
The near-term bias favors another try to $2,250–$2,320 as long as Ethereum closes above $2,165. A true regime shift would be indicated by a persistent break over $2,380–$2,388, with $2,575 as the next reasonable target. Within weeks, the $2,450–$2,500 range becomes relevant in a more hopeful scenario where general market circumstances continue to be favorable.
The bear case depends on ETH closing below $2,108, which would probably result in a retest of the $1,900 region and possibly a return to the $1,747 lows. Bulls currently have the structural advantage due to whale accumulation and increasing momentum, but the derivatives overhang and high overhead supply prevent that advantage from turning into a conviction.
- Check out our free forex signals
- Follow the top economic events on FX Leaders economic calendar
- Trade better, discover more Forex Trading Strategies
- Open a FREE Trading Account
- Read our latest reviews on: Avatrade, Exness, HFM and XM
Related Articles
Sidebar rates
Related Posts
