USOIL Rebounds to $97 as Fragile US-Iran Ceasefire Triggers Partial War Premium Recovery – $100 Next or Fresh Drop to $90?
USOIL (WTI Crude Oil) is trading in the $96.90-$97.90 per barrel range on April 9, 2026 - and while its been a tough 24 hours...
Quick overview
- USOIL is currently trading between $96.90 and $97.90 per barrel, showing a modest rebound after a significant decline.
- The recent drop in oil prices was triggered by a US-Iran ceasefire announcement, which eased concerns about disruptions in the Strait of Hormuz.
- Market sentiment is cautiously optimistic, with analysts predicting potential relief at the pump due to falling energy costs.
- Long-term forecasts for oil prices remain uncertain, with expectations ranging from $90 to over $130 depending on geopolitical developments.
USOIL (WTI Crude Oil) is trading in the $96.90-$97.90 per barrel range on April 9, 2026 – and while its been a tough 24 hours, USOIL is showing signs of a modest rebound of 0.8-3% in early trading after that sharp decline the day before. May 2026 futures contracts have been juggling between $96.25-$98.38 intraday.
Why’s USOIL taking a hike back towards 97 today?
After a dramatic 15-17% free fall on April 8, triggered by that US-Iran ceasefire announcement, prices are now starting to recover. And that’s largely because traders are still trying to figure out what’s going to happen with the Strait of Hormuz reopening and with that two-week truce that was announced. They’re just not entirely convinced that everything is going to be alright.
Recent Price Action
Oil prices took a pretty dramatic plunge on April 8 following that announcement about the US-Iran ceasefire, which came with conditions for reopening the Strait of Hormuz. This basically removed a big chunk of the “war premium” that had driven prices all the way up to $110-$117 earlier in the week. WTI dipped towards or below $90-$95 for a bit before recovering.
Now, as we speak, prices are consolidating with a bit of upward pressure still around. The move marks a pretty significant unwind from those recent highs we saw tied to all the Middle East tensions – but, year-to-date, we’re still looking pretty good (around 40%+ in some contracts) thanks to all those supply risks we saw early on.
Key Drivers Today
- Geopolitics (The Big Deal): The ceasefire has certainly eased some of the immediate worries about disruptions to oil flows through the Strait of Hormuz (which is a major chokepoint for about 20% of global oil trade). But with reports of all sorts of stuff still going on, accusations flying back and forth, and uncertainty about what happens after that two-week period, we’re seeing a partial recovery. And let’s be real – if things go south again, we could see some serious volatility.
- Market Sentiment: The ceasefire news sent a pretty broad “risk-on” signal, with global stocks rallying as energy costs came back down to earth. Analysts are saying that could lead to some relief at the pump (US gasoline prices might drop a few cents in the coming days/weeks) – but we’ll just have to wait and see.
- Other Influences: No real immediate impact right now from US inventory data or Fed policy signals – although those broader macro factors (dollar strength, demand outlook) are playing a secondary role. If the truce falters, we could see supply concerns resurface.
Broader Context
Oil has been pretty volatile in early 2026 thanks to those escalating US-Iran/Israel tensions, with prices swinging wildly from lower levels earlier in the year to those triple-digit peaks we saw amid all those supply shock fears.
The ceasefire gives us some short-term breathing room, but a lot of people still think this is just a temporary reprieve. That means there’s still a floor under prices.
Longer-term forecasts are all over the map – with some pretty high odds assigned to ranges like $90-$130+ by month-end, depending on how long the truce holds and what global demand does.
Technical Analysis: WTI Oil Drops to $97 After a Sharp Rejection at $111
WTI crude is trading at around $97.24 after a pretty decisive rejection from that $111.80-$117.60 resistance zone – where it all aligned with the 0.786 Fibonacci retracement and a big old supply zone. The latest move shows some pretty aggressive selling pressure – with a big fat red candle breaking below the $101.30 (0.382 Fib) level.
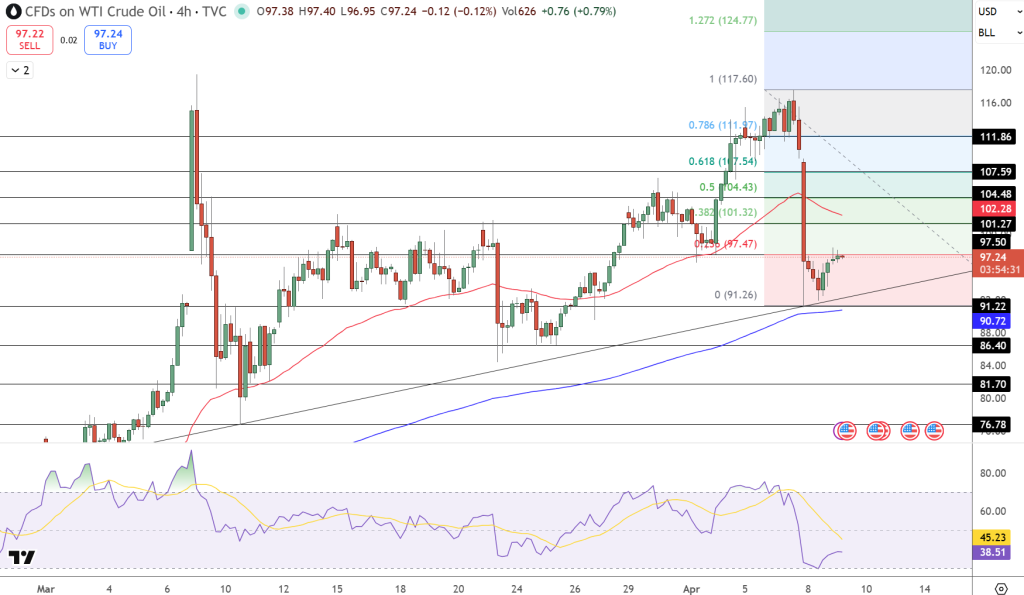
Now we’re seeing a bit of stabilisation above the $91.26 support mark, which is that Fibonacci base and just above the rising trendline from early March. Those recent candles are showing some smaller bodies, which is our market’s way of saying “hey, let’s pause for a second and see what happens here”.
The 50-SMA near $102.20’s now acting as resistance while the 100-SMA around $90.70 is still holding up as deeper dynamic support. If we break below $91, we could see $86.40 and $81.70 come into play. On the upside, we’d need to get back above $101.30 to shift the momentum back towards $104.40 and $107.50.
The Relative Strength Index (RSI) has dropped toward 38–45, reflecting weakening momentum but nearing oversold conditions.
Trade Idea: Sell below $96 targeting $91 and $86, with stop above $101.
- Check out our free forex signals
- Follow the top economic events on FX Leaders economic calendar
- Trade better, discover more Forex Trading Strategies
- Open a FREE Trading Account
- Read our latest reviews on: Avatrade, Exness, HFM and XM
Related Articles
Sidebar rates
Related Posts
