Barclays (BCS) Stock Rally: +344% in 2 Years – Too Late to Enter?

Quick overview
- Barclays (BCS) has experienced a remarkable 344% increase over the past 24 months, establishing itself as a high-momentum outperformer.
- The stock has appreciated over 712% since 2019, indicating a long-term trend reversal and a multi-year uptrend.
- Despite its impressive recovery, Barclays remains below its historical peak of $63 from 2007, facing significant resistance at key Fibonacci levels.
- Current technical indicators show mixed signals, with bullish momentum on higher timeframes but early signs of weakness on shorter timeframes.
Over the past 24 months, Barclays (BCS) has delivered an exceptional upside move, advancing roughly 344% and firmly establishing itself as a high-momentum outperformer within its peer group. This magnitude of appreciation is not merely a function of cyclical recovery, but rather indicative of a sustained trend structure characterized by higher highs and higher lows across multiple timeframes. From a technical standpoint, the rally reflects persistent institutional accumulation, with price action consistently respecting key moving averages and breakout levels, suggesting strong underlying demand.
Barclays Stock Surged by 712% Over the Last 7 Years
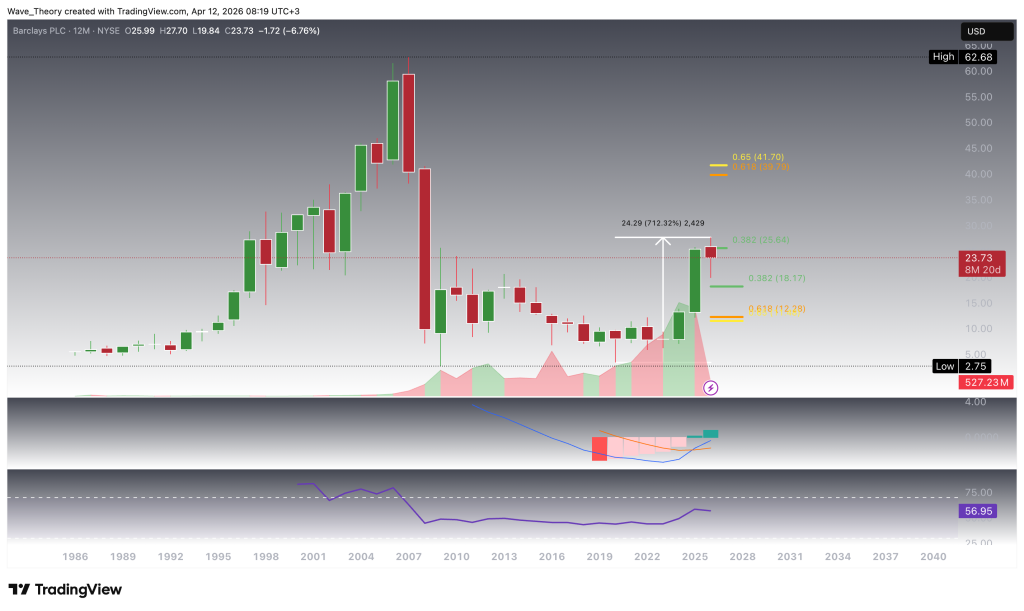
Since 2019, Barclays (BCS) has delivered an extraordinary upside move, appreciating by over 712% from trough to peak and printing a recent cycle high at $27.7 earlier this year. From a structural perspective, this rally reflects a sustained long-term trend reversal, transitioning from a prolonged accumulation phase into a clear multi-year uptrend.
On the higher timeframe, momentum confirmation is evident: the MACD lines have executed a bullish crossover on the yearly chart, accompanied by a steadily upticking MACD histogram over the past few years. This combination signals strengthening underlying momentum and reinforces the validity of the long-term trend continuation.
However, despite this impressive recovery, the stock remains structurally below its historical peak near $63, established in 2007. From a technical standpoint, this leaves substantial overhead supply and untested resistance zones in play. For Barclays to reapproach these levels, price must first decisively clear key Fibonacci resistance levels at $25.6 and $41.5. These zones represent critical inflection points where prior distribution is likely to re-emerge, making them essential checkpoints for any sustained continuation toward all-time highs.
Golden Crossover on the Monthly Chart of Barclays
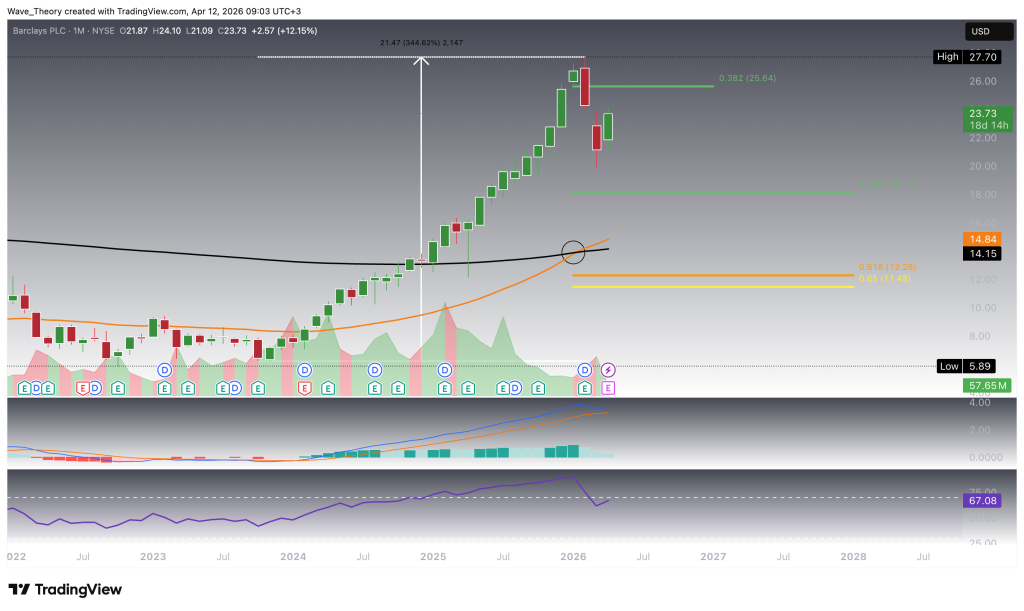
On the monthly timeframe, Barclays (BCS) has printed a confirmed golden crossover in its EMA structure, providing a strong technical validation of the prevailing long-term bullish trend. This development typically signals sustained trend continuation, particularly when supported by higher timeframe momentum alignment. However, momentum indicators are beginning to show early signs of exhaustion. The RSI remains in neutral territory, albeit approaching overbought conditions, indicating that while upside potential persists, the trend is no longer in its early expansion phase. Concurrently, the MACD histogram has been ticking lower for three consecutive months, reflecting waning bullish momentum and increasing the likelihood of an imminent bearish crossover in the MACD lines on the monthly chart.
From a price structure standpoint, Barclays briefly broke above the 0.382 Fibonacci resistance at approximately $25.6 but failed to sustain acceptance above this level, closing back below it in February. This rejection triggered a corrective phase, with price action declining toward the 0.382 Fibonacci support near $18.2. Below that, the next significant downside support is located around $12, marking a deeper retracement zone should selling pressure accelerate.
Despite this corrective structure, near-term price action is attempting to stabilize, and Barclays is currently positioned for a potential rebound within the current month. A successful recovery from this region could see the stock retest the $25.6 Fibonacci resistance, which remains the key level to reclaim in order to re-establish bullish continuation on the monthly timeframe.
Mixed Signals on the Weekly Chart
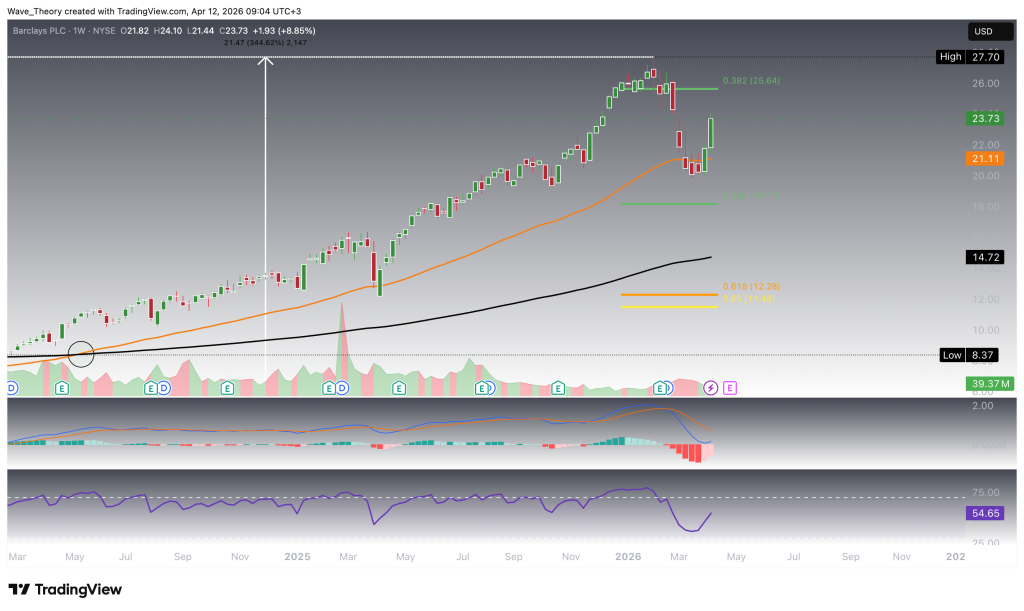
On the weekly timeframe, Barclays (BCS) presents a constructive yet somewhat conflicting technical picture. The EMA structure has printed a golden crossover, reinforcing a bullish mid-term trend and indicating that the broader directional bias remains to the upside. Supporting this, the MACD histogram has begun ticking higher since last week, suggesting a re-acceleration in bullish momentum following the recent corrective phase.
At the same time, the RSI continues to hover in neutral territory, reflecting the absence of extreme momentum conditions and leaving room for further upside expansion without immediate overbought pressure. Taken together, these indicators form a mixed but overall bullish-leaning setup, where trend confirmation is present, yet momentum is still in the early stages of rebuilding.
From a price action perspective, Barclays has shown notable strength over the past week, pushing higher with conviction and successfully breaking above the 50-week EMA resistance at approximately $21. This breakout marks a technically significant development, as it signals a shift in market structure and opens the door for further upside continuation, provided the level now holds as support.
Golden Ratio Resistance at $25 – Decisive Break or Rejection?
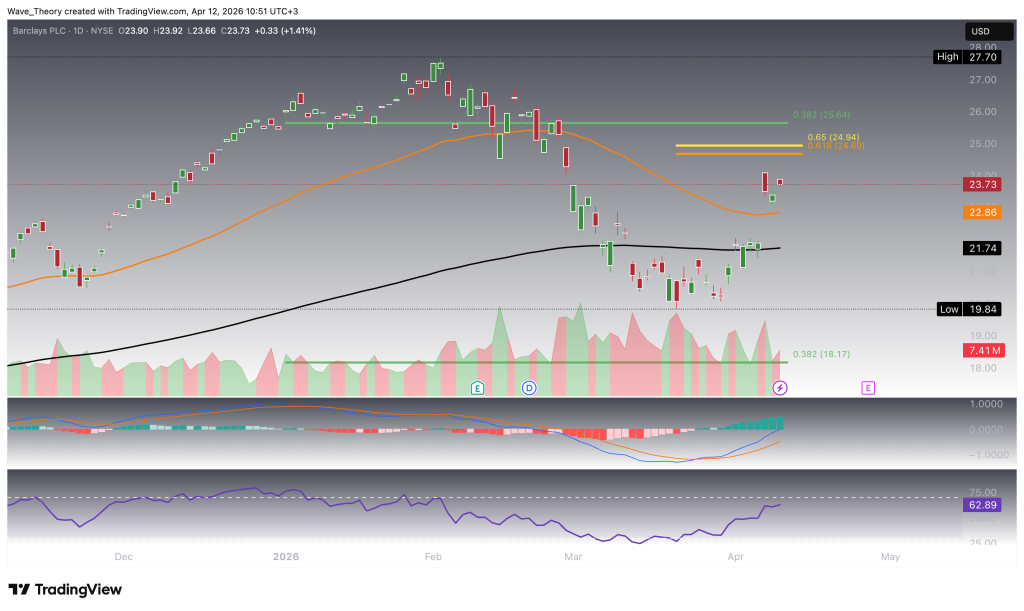
Barclays is approaching a critical resistance at the golden ratio near $25, where a major decision point emerges between continuation and rejection. On the daily chart, the indicators present a clearly bullish picture: the EMAs have formed a golden crossover, confirming the trend bullishly in the short- to medium term, while the MACD lines are bullishly crossed and the histogram exhibits a clear uptrend, signaling strengthening momentum. At the same time, the RSI remains in neutral territory, suggesting the move is not yet overextended and still has room to continue. Price has already reclaimed key trend-defining levels, breaking above the 200-day EMA at $21.74 and the 50-day EMA at $22.86, reinforcing the shift back into a bullish regime. A continuation of this upward trajectory could push the stock toward the golden ratio at roughly $25, where it faces significant resistance; a decisive bullish breakout above this level would likely open the path toward the previous high at $27.7 and potentially beyond, whereas failure at this level could result in a short-term rejection or consolidation before the next attempt.
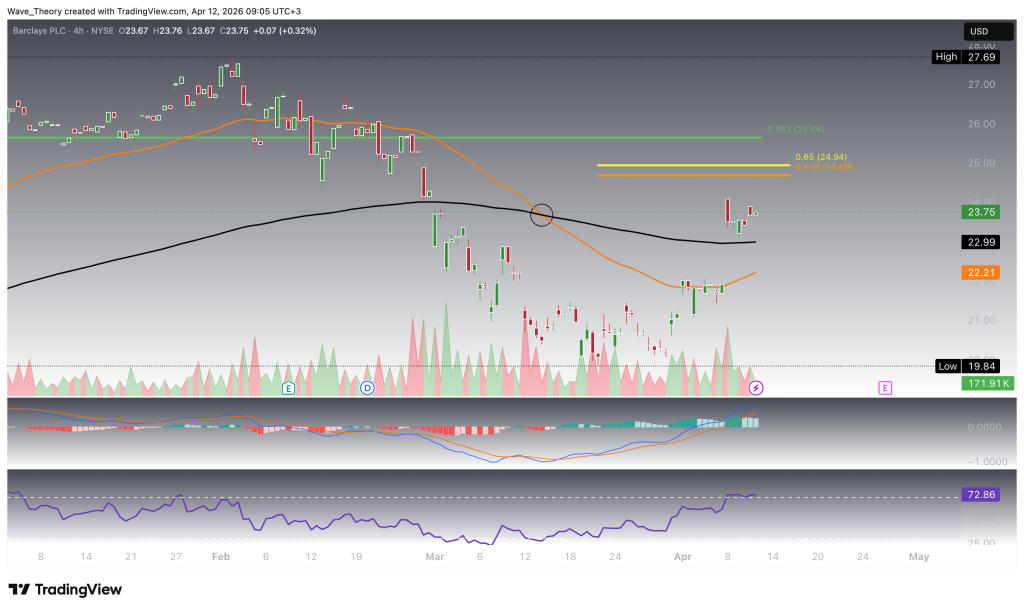
Death Cross on the 4H Chart – Short-Term Weakness Emerging
On the 4H chart, Barclays is showing early signs of short-term weakness, as the EMAs have formed a death cross, confirming a bearish shift in the immediate trend. This is further supported by the MACD histogram ticking lower, indicating fading momentum, even though the MACD lines themselves remain bullishly crossed, suggesting the bearish pressure is still developing rather than fully established. At the same time, the RSI remains in neutral territory, reflecting a lack of extreme conditions and leaving room for further downside or stabilization. Overall, this setup points to a short-term cooling phase within a broader bullish structure, where momentum is weakening but not yet fully reversed.
- Check out our free forex signals
- Follow the top economic events on FX Leaders economic calendar
- Trade better, discover more Forex Trading Strategies
- Open a FREE Trading Account
- Read our latest reviews on: Avatrade, Exness, HFM and XM
Related Articles


Sidebar rates
Related Posts
