A Bearish Chart Setup in Gold, Who Wants to Trade It?
Gold has been sliding down since it failed to break the 100 SMA on the monthly chart a few weeks ago. Since then it has been one-way traffi
Gold has been sliding down since it failed to break the 100 SMA on the monthly chart a few weeks ago. Since then it has been one-way traffic, but the buyers managed to push it a bit higher today, forming a retrace on the H1 chart, as you can see below.
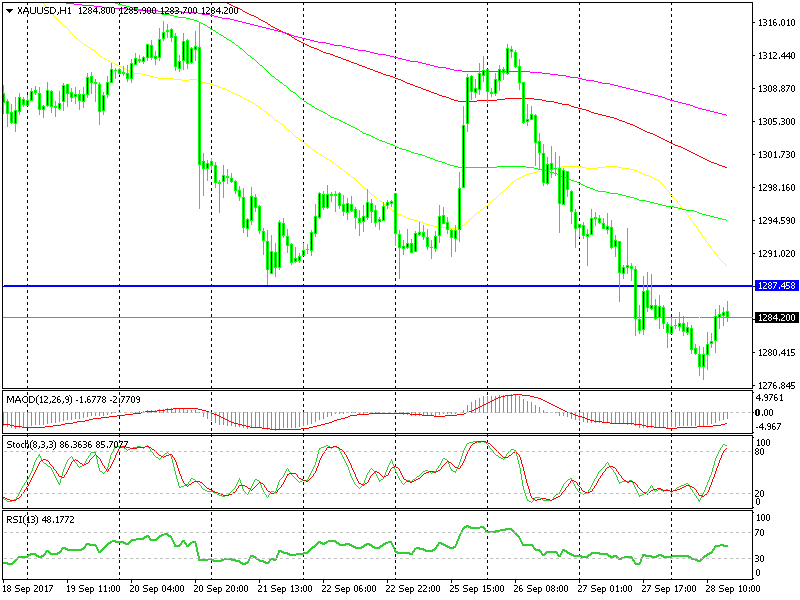
The 2 dojis are pointing down.
Now, this timeframe chart is overbought with stochastic near the top of its window, so that suggests that the pullback/retrace is over.
Besides that, the last two hourly candlesticks formed two dojis which are reversing signals after an uptrend. Gold has been in an uptrend today if we switch to the 15 minute chart, so the dojis are pointing down.
 The 200 SMA looks like a decent resistance.
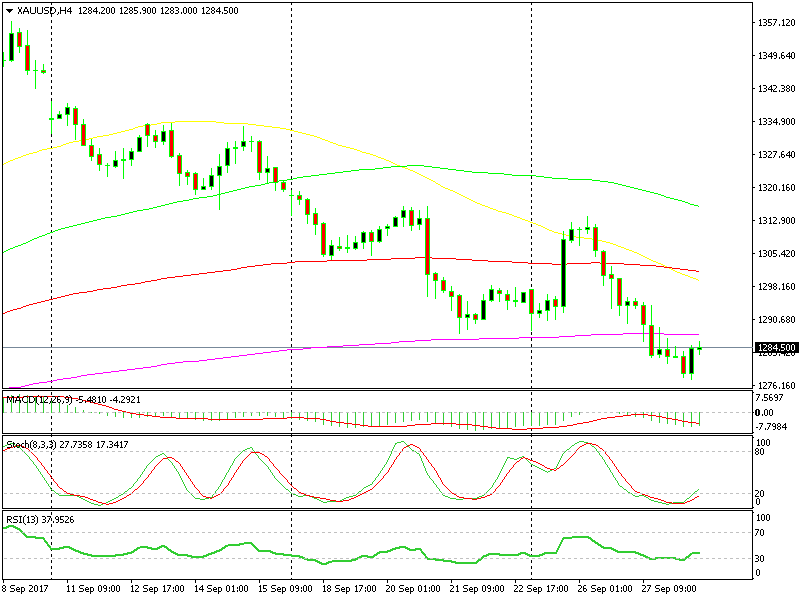
Changing to the H4 chart, we see that the 200 SMA (purple) used to be support last week, so it will likely turn into resistance now. That level was also supported last week, which strengthens it further.
I’m not opening a sell Gold signal just yet; I would have preferred to see the 200 SMA, but the buyers look too weak. So, I’m just watching the price action so hang on a minute guys.
- Check out our free forex signals
- Follow the top economic events on FX Leaders economic calendar
- Trade better, discover more Forex Trading Strategies
- Open a FREE Trading Account
- Read our latest reviews on: Avatrade, Exness, HFM and XM
Related Articles


Sidebar rates
Related Posts
