Nov. 20 – Are You Up To Catch Retracement In Gold?
What’s up fellas. It is a normal Monday, and the market is expected to continue with thin volatility. Yet, the technical side of gold is
What’s up fellas. It is a normal Monday, and the market is expected to continue with thin volatility. Yet, the technical side of gold is signaling a fair opportunity for us. Let's check this out!
Gold // XAUUSD- Technical View
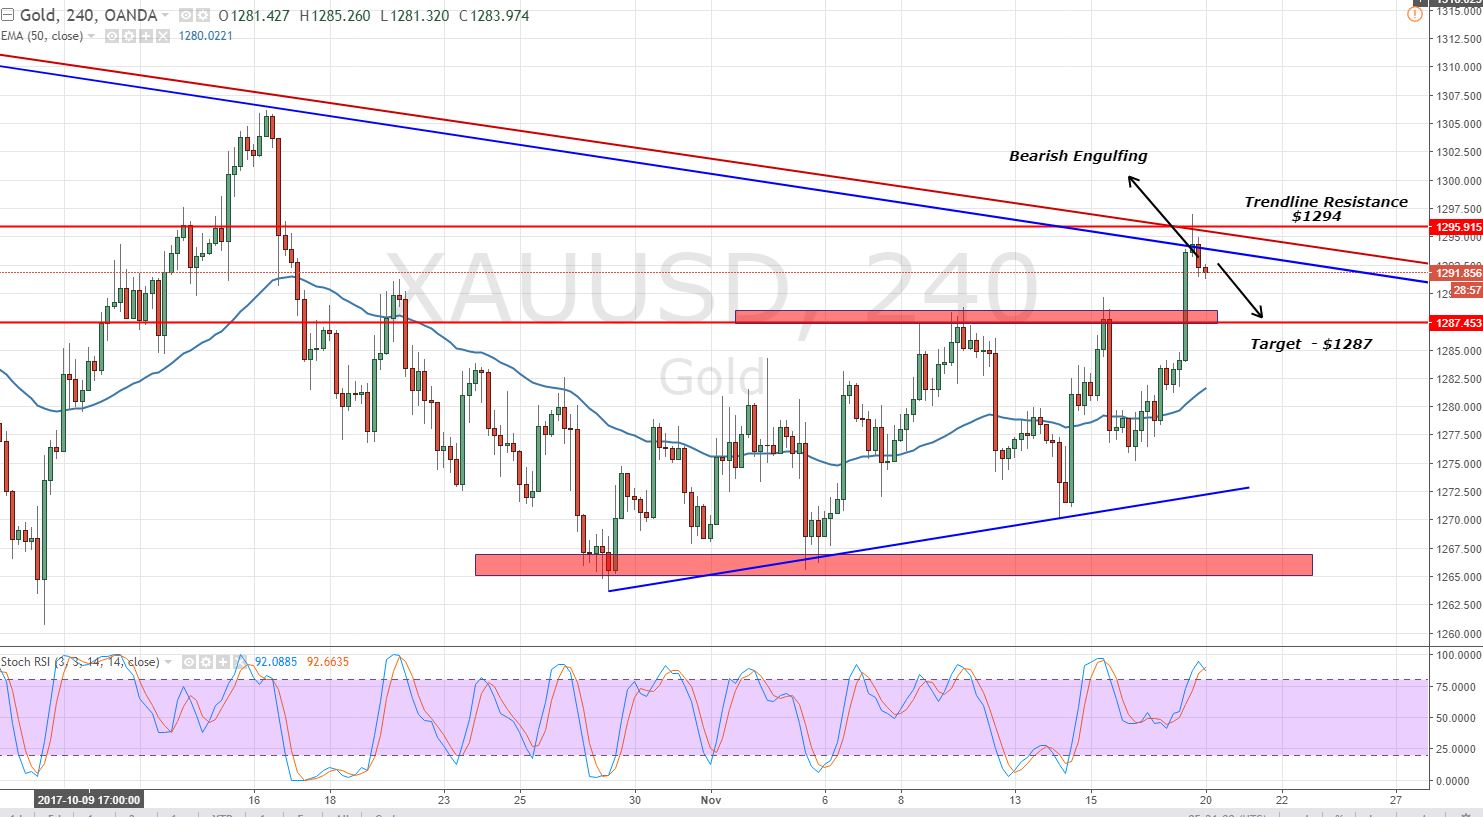
On the 4- hour chart, we can see a big bearish candle (bearish engulfing) which is engulfing the previous bullish candle (shooting star). The shooting star candlestick itself demonstrates the bearish reversal. That's one of the reason we can open a sell in Gold today.
Stochastic and RSI has entered the overbought zone. At the moment, it is holding at 86 & 89 respectively and signifying that entering a sell position may end up in profits today.
 Gold – 4 – Hour Chart – Overbought Metal
 Gold – 4 – Hour Chart – Overbought Metal
 Now let's have a look at the lagging indicator, the 50 periods EMA. It's holding at $1,281. Yup, it's quite far from the CMP (current market price) and supporting the selling sentiment.
Lastly, the Fibonacci levels are providing an immediate support 23.6% retracement level of $1,291 and 38.2% retracement level of $1,286. Whereas, the bearish trendline is extending a solid resistance at $1,295.
Gold // XAUUSD – Trading Plan
Based on the above analysis, we shared a forex trading signal to enter a sell position below $1,293 with a stop loss above $1,297 and take profit of $1,286 and $1,284. Good luck and trade with care fellows!
- Check out our free forex signals
- Follow the top economic events on FX Leaders economic calendar
- Trade better, discover more Forex Trading Strategies
- Open a FREE Trading Account
- Read our latest reviews on: Avatrade, Exness, HFM and XM
Related Articles
Sidebar rates
