Stellar is Still Bearish: But is XLM Still a Good Investment?
-
- The XLM price finally recovers after bleeding over the last few weeks.
- A downtrend is unavoidable, with several technical resistances pushing the price south.
- Stellar can retest a new support level at $0.20, but bears could push it lower to reverse the recovery.
The entire market stalled for most of last week, before some gains were witnessed as the week came to an end. Bitcoin gained 2.88% on Thursday, after rising 3.45% on Wednesday, to end the day just above $35,500. It was a mixed experience for the other major cryptos on Thursday. Polkadot shed 0.26% of its opening price while Cardano’s ADA was the highest gainer of the day, adding 8.73% to its price.
Ethereum emerged as the lowest gainer, despite the execution of the London hardfork on the smart contract giant’s network. This is an upgrade to the Ethereum blockchain that includes the controversial EIP-1559, which is aimed at improving the network’s fee model. On Thursday, by the end of the day, ETH was trading at 1.04% more than the opening price, as the bulls failed to close above $2,000
Can the Bulls overturn Steller’s Bearish Run?
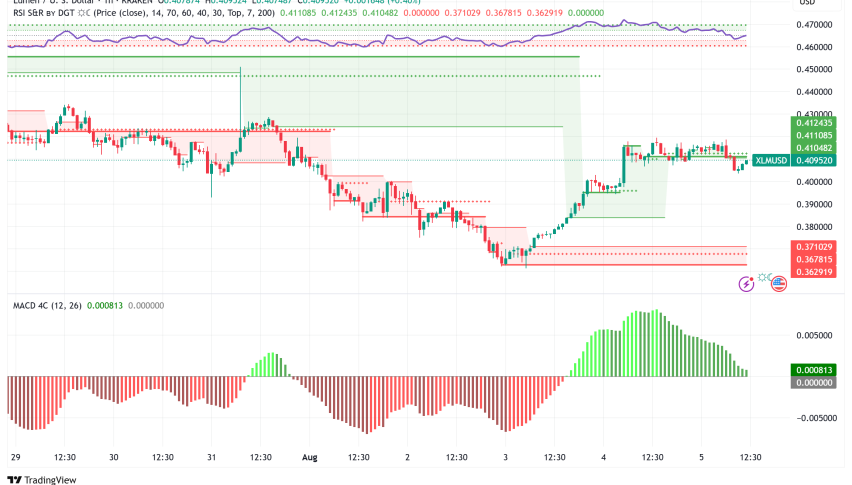
The 12-hour chart indicates that the XLM/USD price has been recovering steadily, having tested a new support level at $0.20. However, it faces resistance at $0.27, as the bears appear determined to bring the prices back to $0.20, a support level that we witnessed in January. This appears to be a warning to the bulls, who intend to hold Stellar, that the story might not be very rosy.
There appears to be a significant break downwards, despite the recovery experienced in the last few trading sessions. Moreover, it seems like Stellar will not recover back to this level before the end of trading today, which makes $0.27 a significant resistance area upwards.
XLM/USD 12-Hour Chart
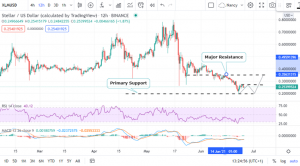
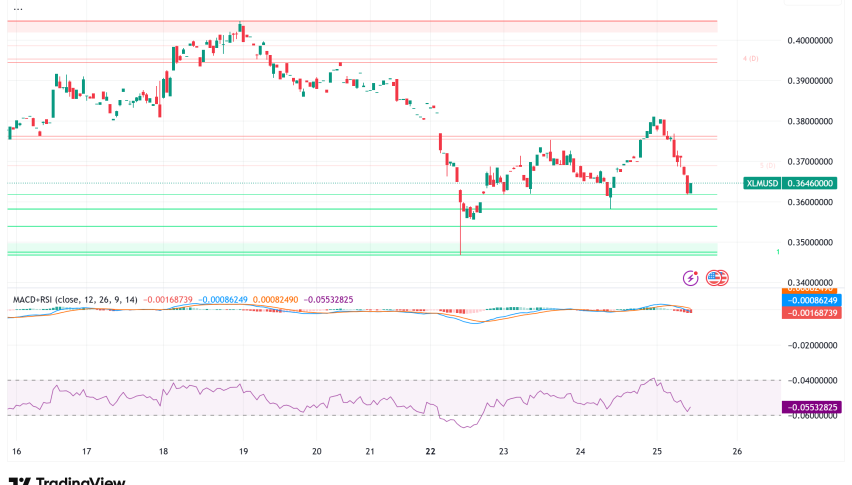
It is worth noting that the RSI affirms this bearish outlook, following the reversal downwards away from the midline. Moreover, the determination to move close to the oversold region increases the pessimism among prospective buyers. This means that Stellar’s price could rise a little bit, but if it doesn’t close the day at levels above 0.27, it will be evident that the bearish outlook cannot be overturned within the next trading periods, and that XLM could retest the $0.20 support level, or even go lower.
On the upside, the technical outlook from the Moving Average Convergence Divergence (MACD) may show a golden cross, which is a call to buy signal, during the next trading sessions. The buy signal will occur when the MACD line (blue) crosses above the signal line (orange). If this happens, XML might close the day above $0.27, and a continuation upwards could ensue, until it meets major resistance at $0.35, which has also acted as support in the past.
- Check out our free forex signals
- Follow the top economic events on FX Leaders economic calendar
- Trade better, discover more Forex Trading Strategies
- Open a FREE Trading Account
- Read our latest reviews on: Avatrade, Exness, HFM and XM
Related Articles
Sidebar rates
Related Posts
