Prices Forecast: Technical Analysis
For today, we predict Ankr’s closing price to be around **$0.0035**, with a potential range between **$0.0034** and **$0.0036**. Looking ahead to the week, we anticipate a closing price of approximately **$0.0036**, with a range of **$0.0035** to **$0.0037**. The current RSI of **44.0755** indicates a neutral trend, suggesting that the price may not experience significant upward momentum in the short term. The ATR remains low at **0.0001**, indicating low volatility, which supports our forecast of a stable price range. The ADX value of **28.5169** suggests a weak trend, reinforcing the idea that Ankr may continue to trade sideways. The price has recently shown a tendency to bounce off the lower Bollinger Band, which is currently at **$0.0037**, indicating potential support. Overall, the technical indicators suggest a cautious approach, with the possibility of slight upward movement if buying pressure increases.
Fundamental Overview and Analysis
Ankr has recently faced downward pressure, with its price declining from **$0.0062** to the current **$0.0035**. This decline can be attributed to a combination of market volatility and investor sentiment shifting towards more stable assets. Factors such as technological advancements in blockchain and decentralized finance continue to influence Ankr’s value positively, but competition from other platforms poses a challenge. Investor sentiment appears mixed, with some viewing Ankr as undervalued given its potential for scalability and expansion in the decentralized cloud computing space. However, regulatory uncertainties and market fluctuations remain significant risks. Currently, Ankr’s valuation seems to be on the lower end, suggesting it may be undervalued, presenting a potential buying opportunity for long-term investors. The asset’s future growth will depend on its ability to innovate and adapt to market demands.
Outlook for Ankr
The outlook for Ankr appears cautiously optimistic, with potential for gradual recovery in the coming months. Current market trends indicate a consolidation phase, with prices stabilizing around the **$0.0035** mark. In the short term (1 to 6 months), we expect Ankr to trade within a range of **$0.0034** to **$0.0040**, driven by market sentiment and potential positive news regarding partnerships or technological advancements. Over the long term (1 to 5 years), if Ankr can capitalize on its unique offerings in the decentralized space, we could see significant growth, potentially reaching **$0.0050** or higher. However, external factors such as regulatory changes or major market events could impact this trajectory. Investors should remain vigilant about market conditions and be prepared for volatility as the asset navigates its growth path.
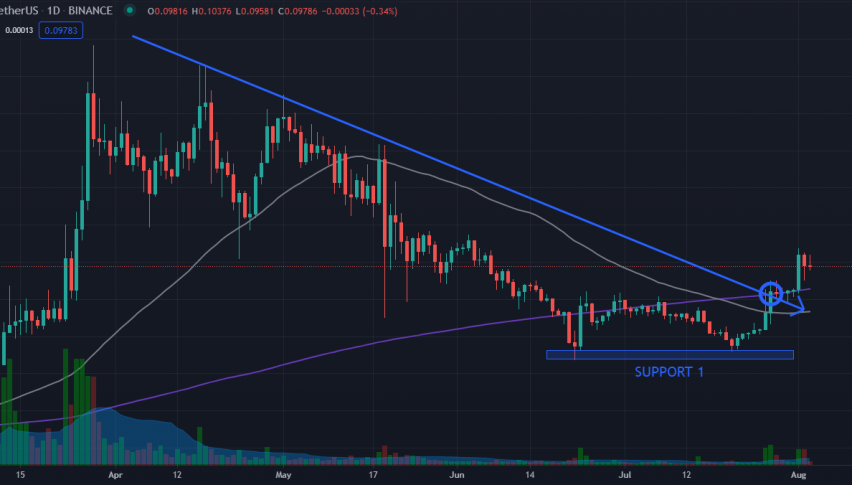
Technical Analysis
Current Price Overview: The current price of Ankr is **$0.0035**, which is unchanged from the previous close. Over the last 24 hours, the price has shown slight fluctuations, indicating low volatility with no significant candles or patterns emerging. Support and Resistance Levels: The identified support levels are **$0.0034**, **$0.0033**, and **$0.0032**, while resistance levels are at **$0.0036**, **$0.0037**, and **$0.0038**. The pivot point is at **$0.0035**, and since the asset is trading at this level, it indicates a neutral market sentiment. Technical Indicators Analysis: The RSI at **44.0755** suggests a neutral trend, while the ATR of **0.0001** indicates low volatility. The ADX at **28.5169** shows a weak trend strength. The 50-day SMA and 200-day EMA are converging, indicating potential for a crossover, which could signal a change in trend direction. Market Sentiment & Outlook: Overall, market sentiment is currently neutral, with price action hovering around the pivot point, and the RSI and ADX suggesting a lack of strong momentum.
Forecasting Returns: $1,000 Across Market Conditions
The table below outlines potential investment scenarios for Ankr, providing insights into how different market conditions could affect a $1,000 investment.
| Scenario | Price Change | Value After 1 Month |
|---|---|---|
| Bullish Breakout | +10% to ~$0.00385 | ~$1,100 |
| Sideways Range | 0% to ~$0.0035 | ~$1,000 |
| Bearish Dip | -10% to ~$0.00315 | ~$900 |
FAQs
What are the predicted price forecasts for the asset?
The predicted daily closing price for Ankr is **$0.0035**, with a range of **$0.0034** to **$0.0036**. For the weekly forecast, we expect a closing price of approximately **$0.0036**, ranging from **$0.0035** to **$0.0037**.
What are the key support and resistance levels for the asset?
The key support levels for Ankr are **$0.0034**, **$0.0033**, and **$0.0032**. The resistance levels are at **$0.0036**, **$0.0037**, and **$0.0038**.
What are the main factors influencing the asset’s price?
The main factors influencing Ankr’s price include market volatility, investor sentiment, and competition within the decentralized cloud computing space. Technological advancements and regulatory changes also play a significant role.
What is the outlook for the asset in the next 1 to 6 months?
In the next 1 to 6 months, Ankr is expected to trade within a range of **$0.0034** to **$0.0040**. This outlook is based on current market sentiment and potential positive developments in the decentralized finance sector.
What are the risks and challenges facing the asset?
Ankr faces risks such as regulatory uncertainties, market volatility, and competition from other platforms. These challenges could impact its growth and price stability in the future.
Disclaimer
In conclusion, while the analysis provides a structured outlook on the asset’s potential price movements, it is essential to remember that financial markets are inherently unpredictable. Conducting thorough research and staying informed about market trends and economic indicators is crucial for making informed investment decisions.