ASML Holding, a Dutch company and global leader in the production of photolithography systems, is integral to semiconductor manufacturing. Its extreme ultraviolet (EUV) lithography machines are critical in producing the cutting-edge semiconductors used in a range of applications, from smartphones to advanced GPUs. Nvidia, whose stock has witnessed a parabolic rise in 2024, relies heavily on ASML’s EUV technology to manufacture the sophisticated chips necessary for artificial intelligence (AI), gaming, and data center applications. With AI and machine learning driving exponential demand for advanced semiconductors, Nvidia’s reliance on ASML strengthens the latter’s stock growth outlook. As the global chip market expands, the increasing demand for ASML’s technology could drive further stock price gains for both companies.
ASML Holding’s Stock Growth Has Been Exceptional
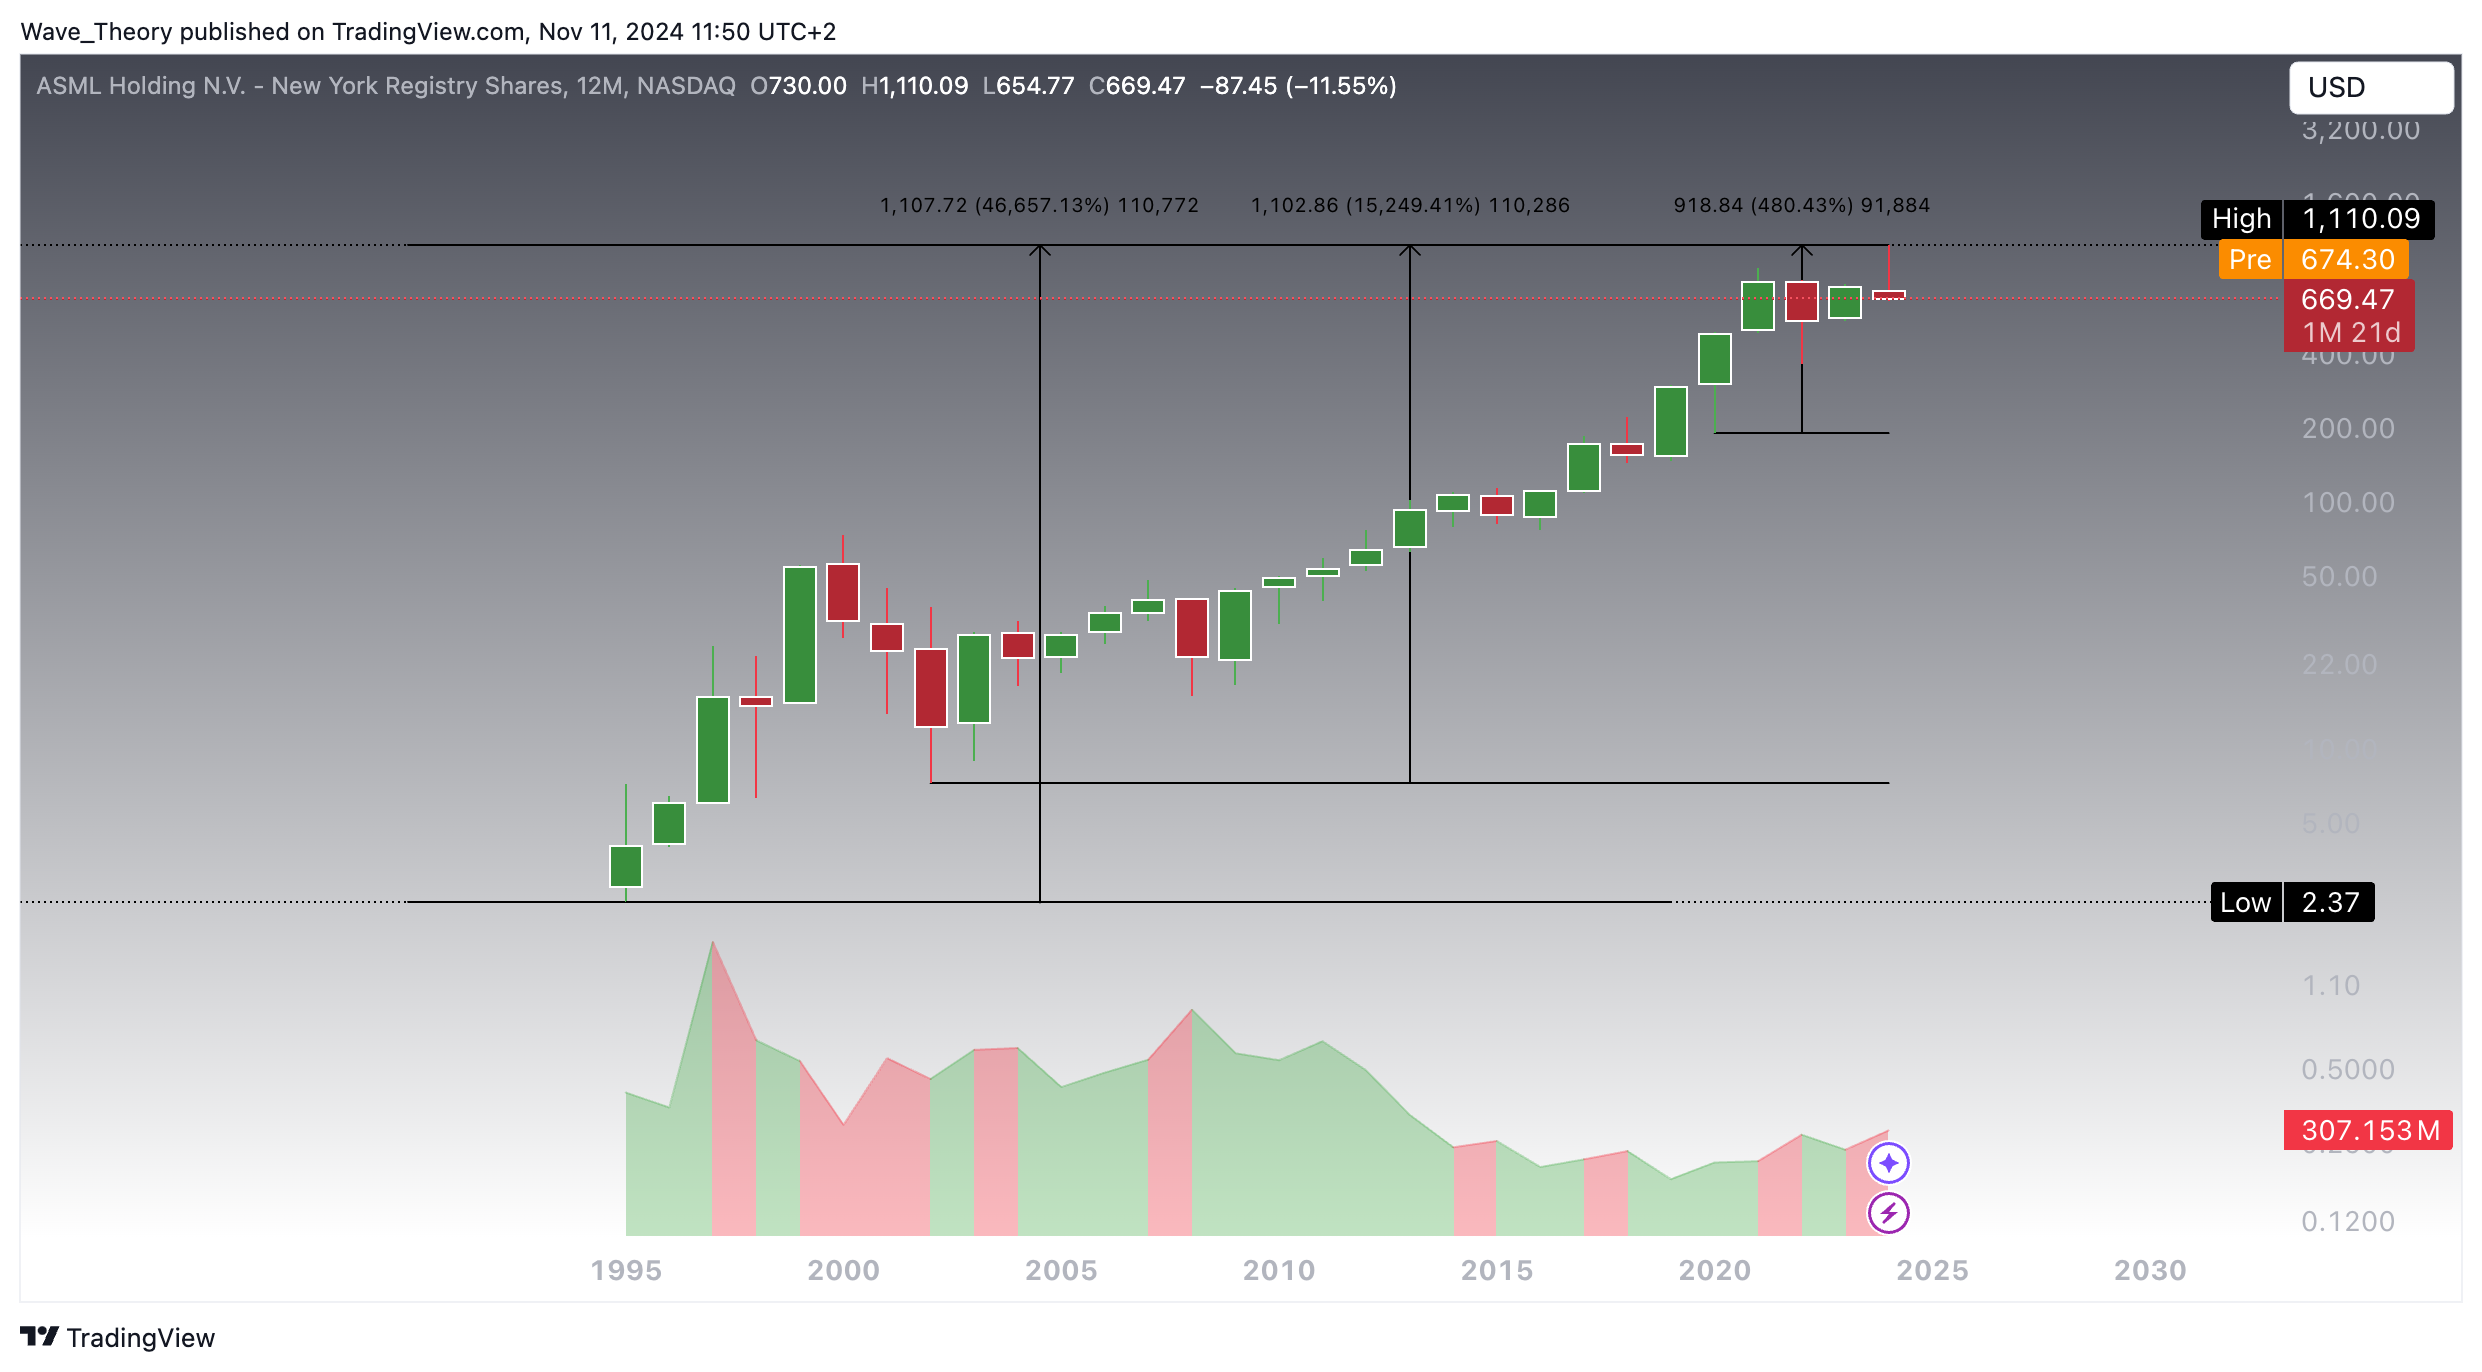
ASML Holding has demonstrated an extraordinary performance, with its stock soaring by a staggering 46,657% since its initial listing on Nasdaq. This meteoric rise includes a 15,249% surge since its 2002 low and an impressive 480% growth since the onset of the pandemic in 2020. Such exponential gains are rarely seen in traditional equities and bear a striking resemblance to the growth pattern of Bitcoin, highlighting ASML’s pivotal role in the semiconductor industry and its strong correlation with the rising global demand for advanced chips. This parabolic rise underscores the company’s dominance in providing essential technology for cutting-edge semiconductor production.
ASML Holding
ASML Holding Hits Historical Support Level: A Critical Turning Point for Stock Performance
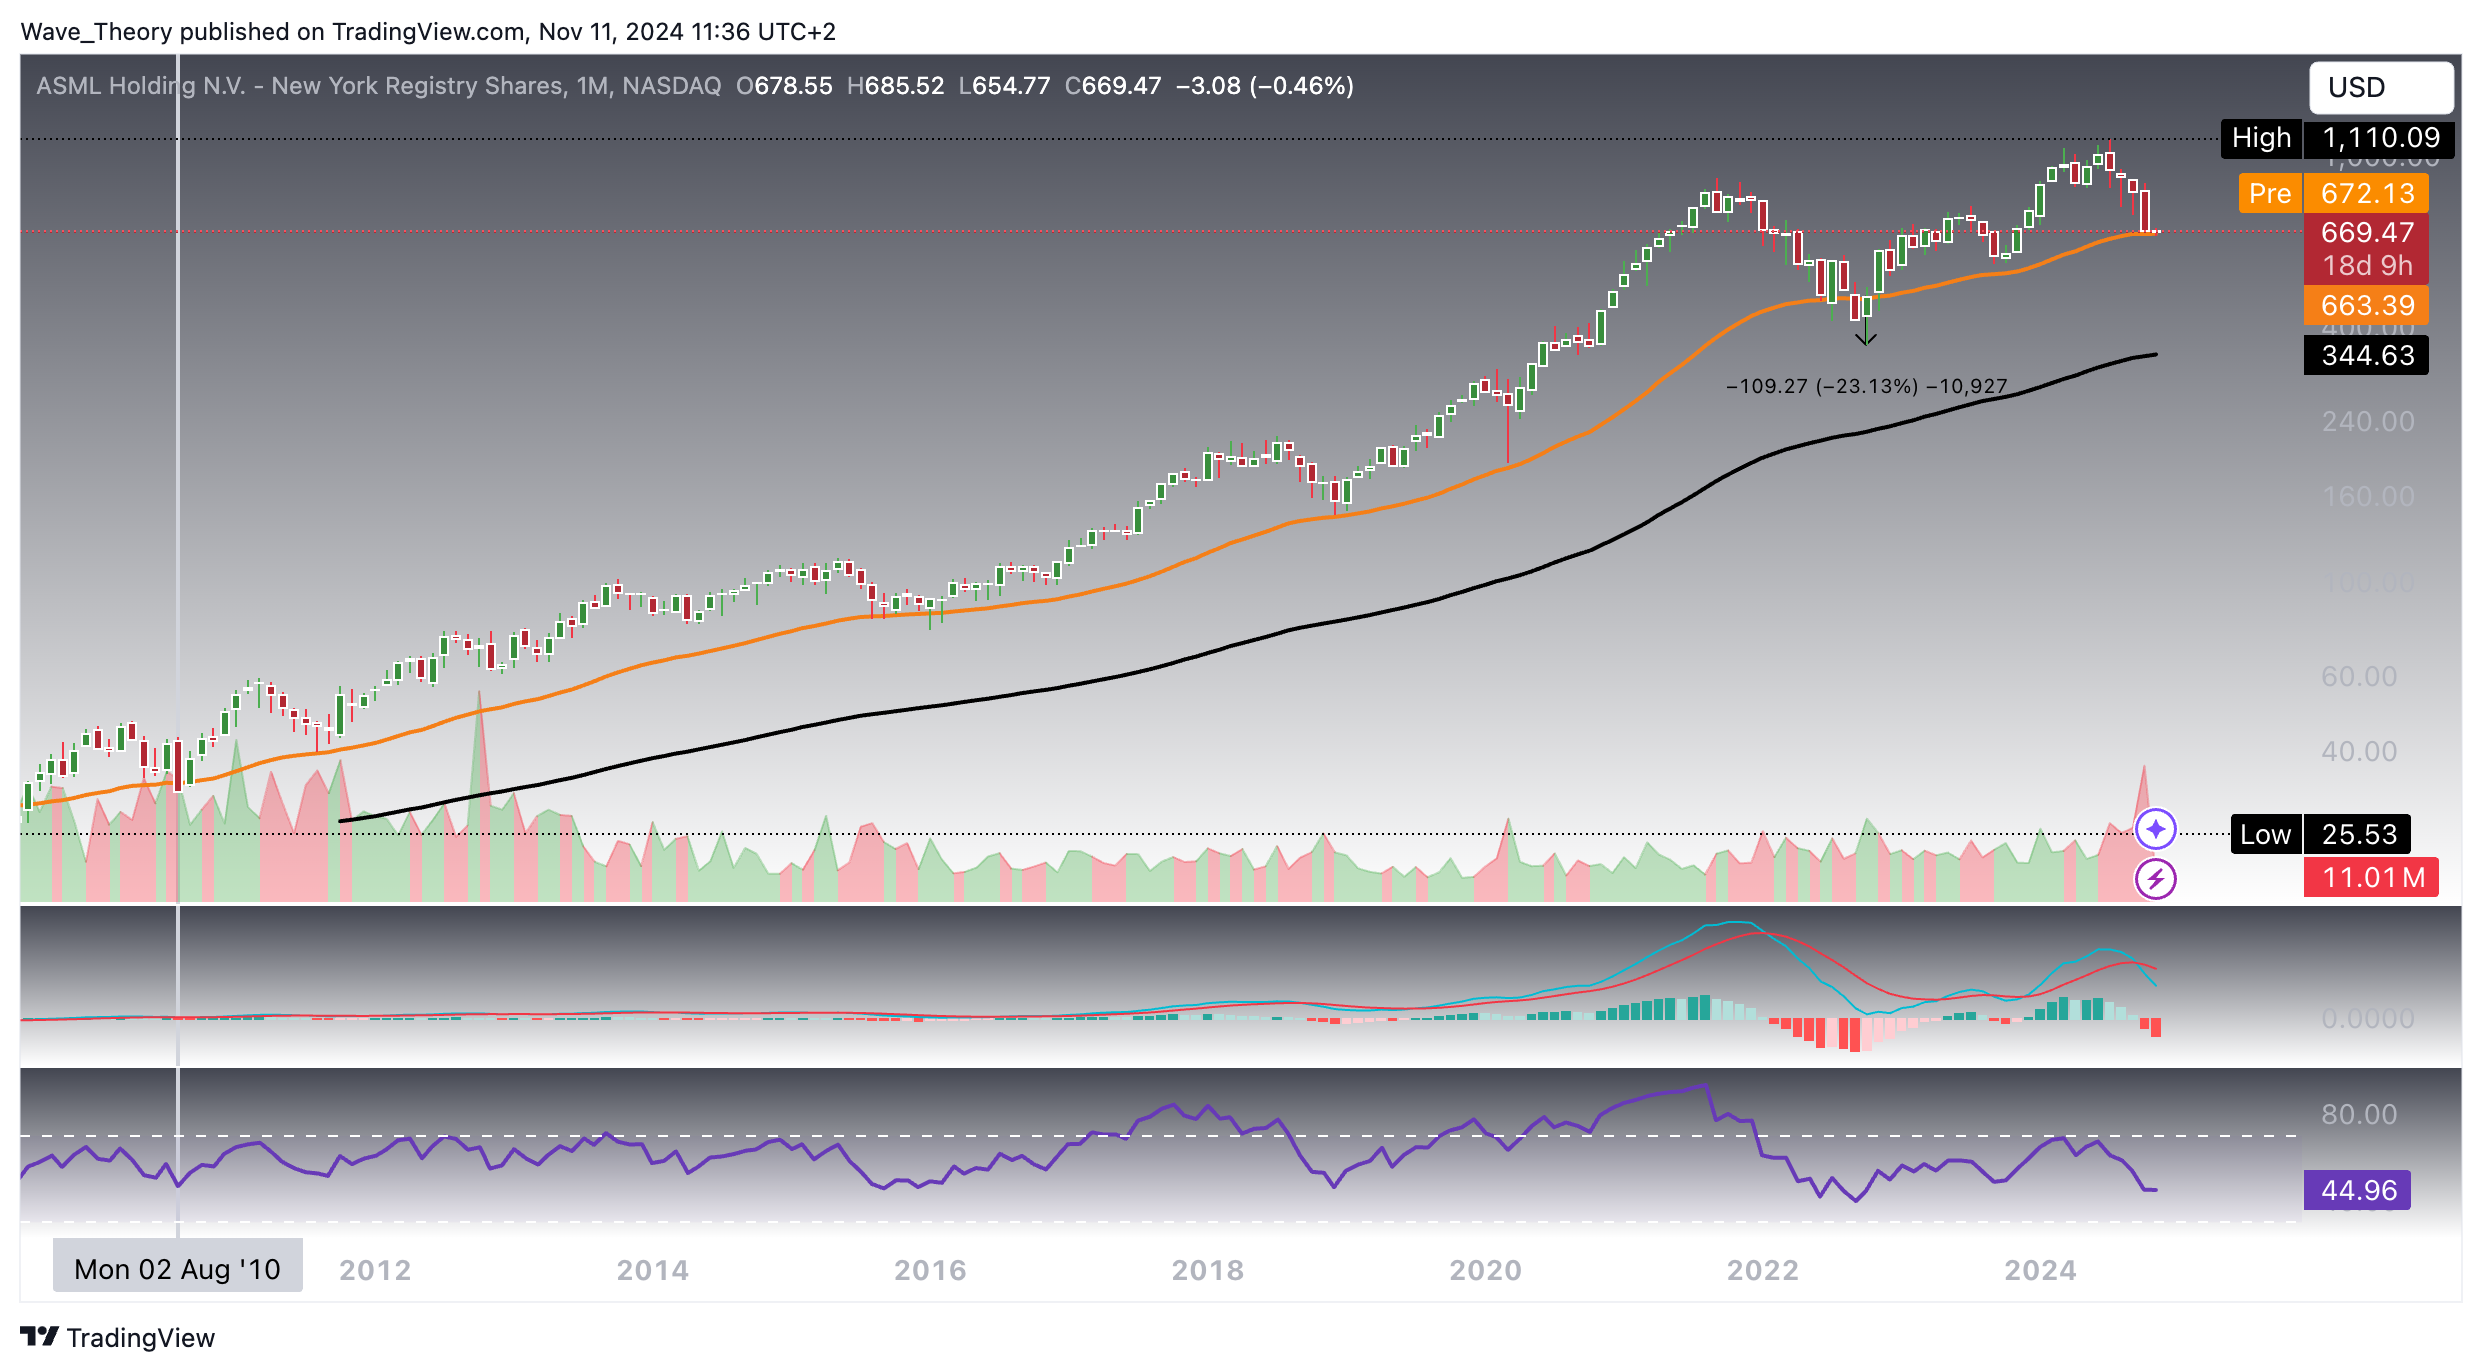
ASML Holding’s stock has historically exhibited strong resilience around its 50-month EMA, returning to this support level seven times in the past 14 years. Each time, the stock rebounded sharply, continuing its parabolic uptrend, with one exception in 2022, when ASML briefly dipped below the 50-month EMA by 23%. However, it quickly recovered and went on to set a new all-time high at $1,110.
This pattern suggests that ASML’s current return to the 50-month EMA at $663 could present an attractive buying opportunity, especially considering the bullish market sentiment with President Trump back in office. Historically, rebounds from this level have led to significant price appreciation.
Despite this, technical indicators provide mixed signals. The EMAs continue to show a golden crossover, confirming a bullish long-term trend. However, the MACD lines have recently crossed bearishly, and the MACD histogram points to a bearish trend. Meanwhile, the RSI remains neutral, offering no clear directional bias. Careful attention should be paid to these signals before making any decisions, as further price action could confirm whether the uptrend will continue.
ASML Holding
ASML Holding Stock Primed for 23% to 54% Upside Potential
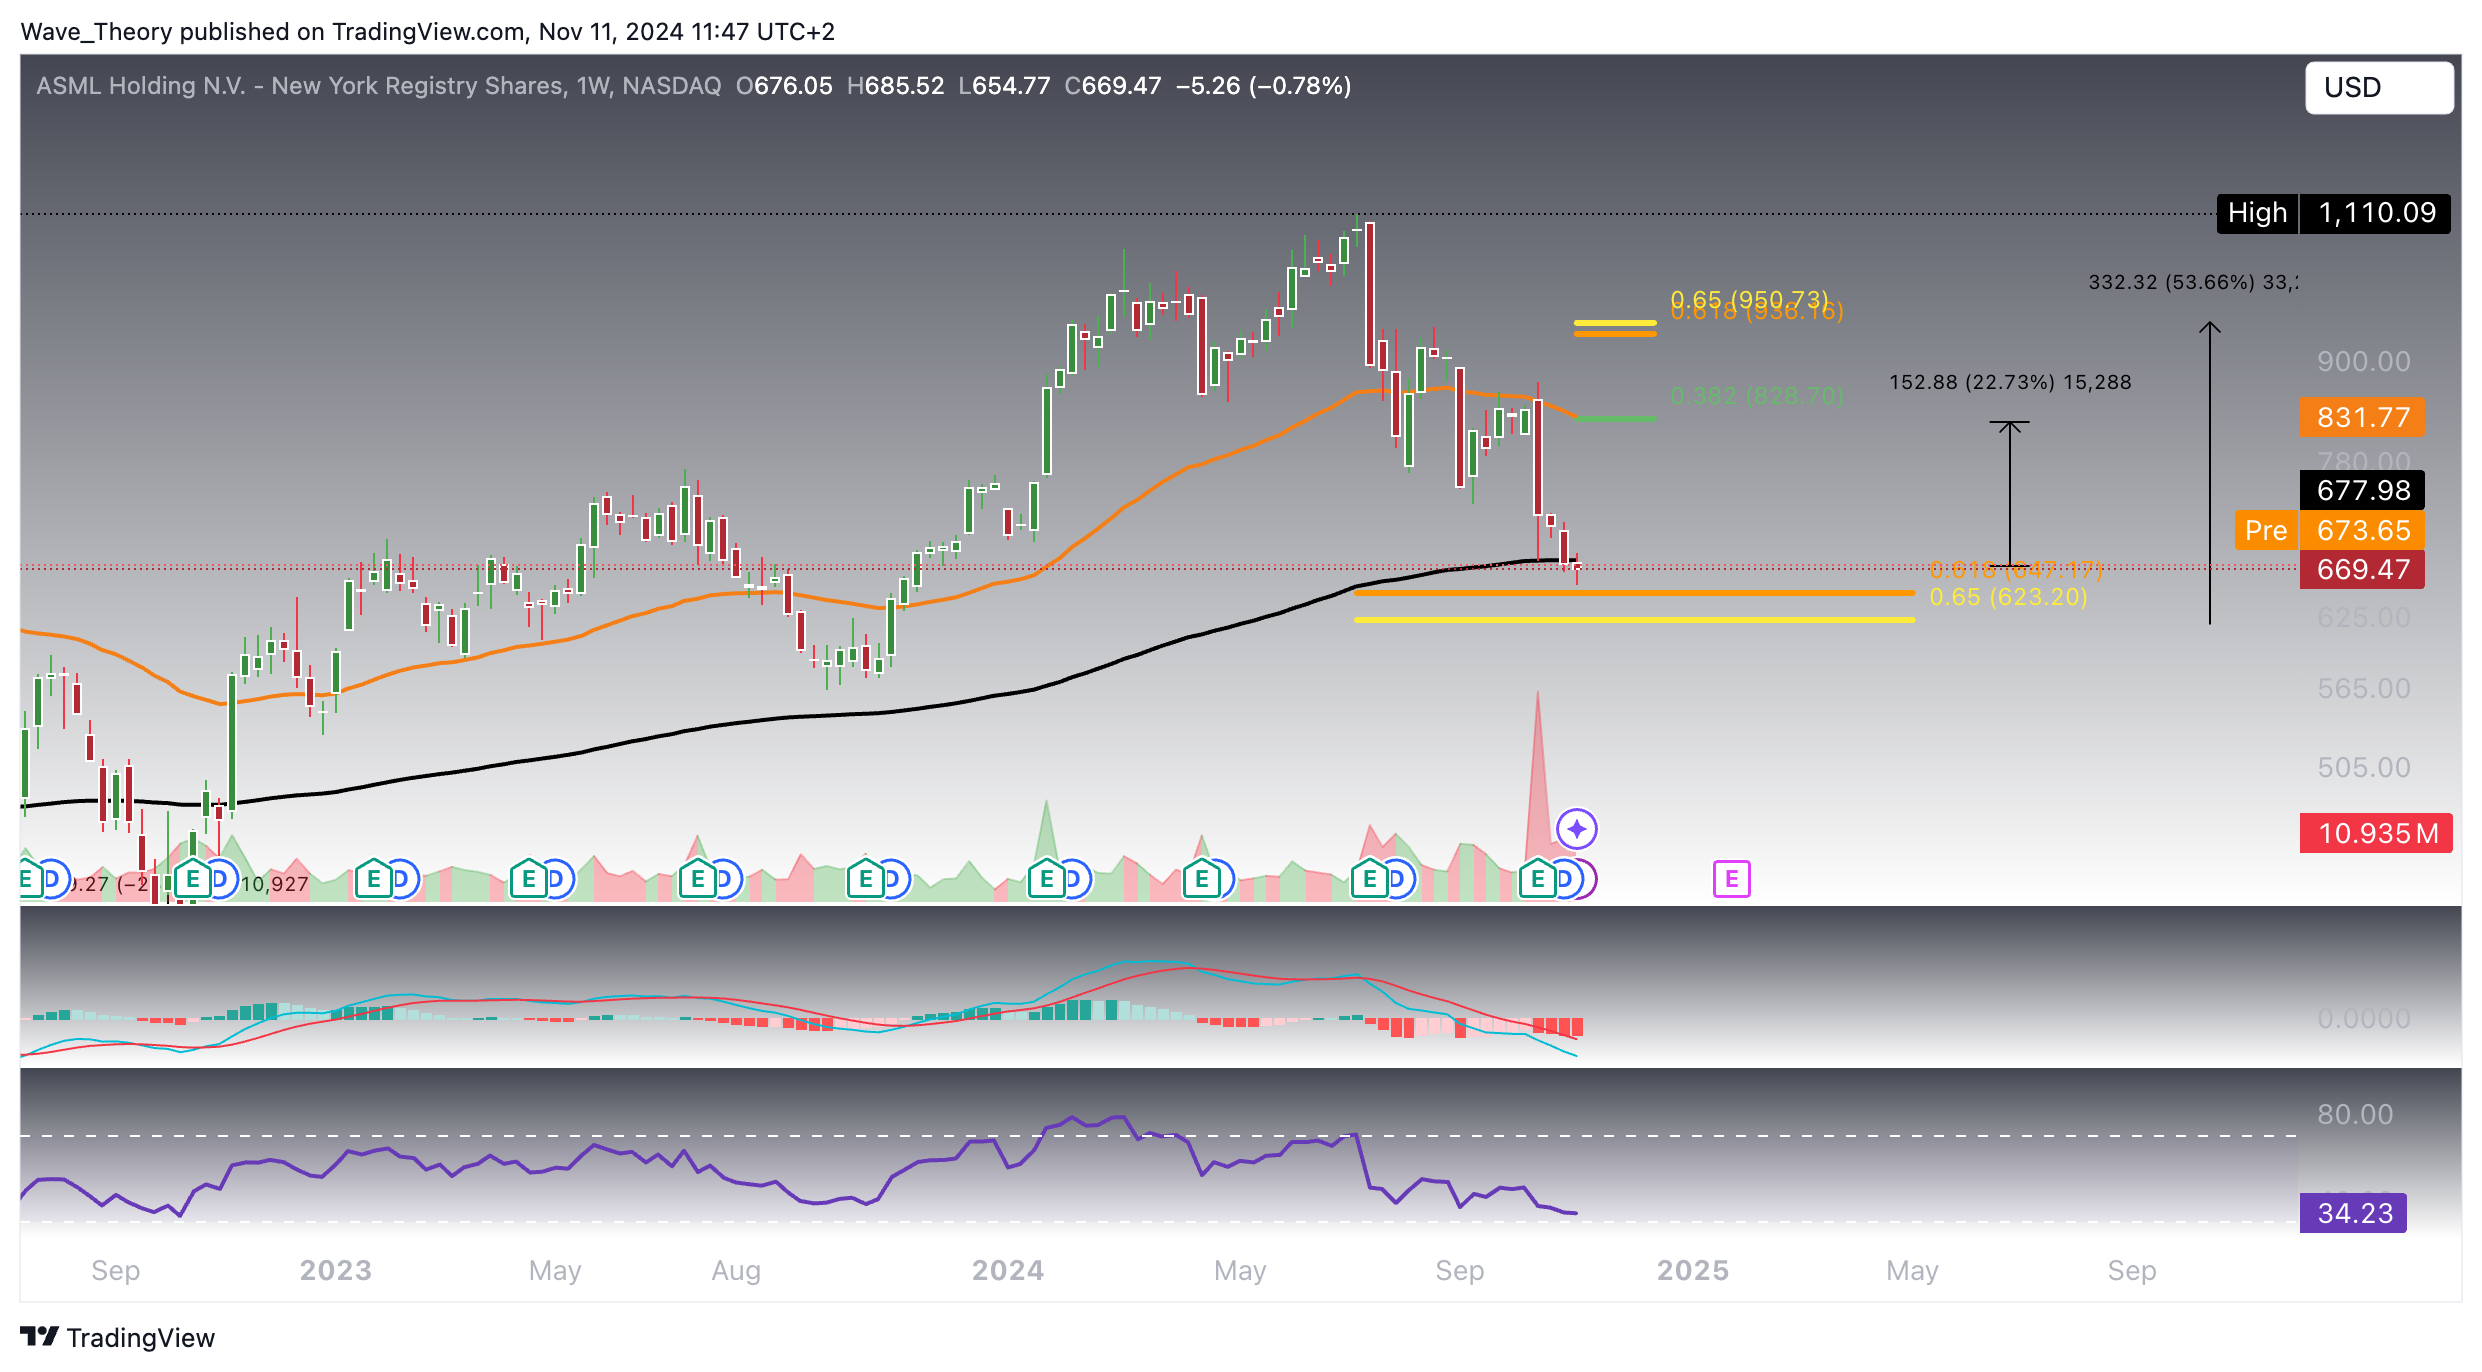
In the weekly chart for ASML Holding, the technical indicators show a nuanced picture. The MACD lines are bearishly crossed, and the histogram has been in a bearish trend for the last four weeks, signaling some downward pressure. Despite this, the bullish structure of the EMAs indicates that the broader trend remains intact. Additionally, the RSI is approaching oversold territory but hasn’t yet given a clear directional signal, which suggests potential for a reversal without outright confirmation.
A key support level lies at the golden ratio of $623, which holds significant technical weight. The price region between $623 and $663 could represent an attractive entry point for long-term investors. Should ASML Holding rally from this zone, it could see a move toward the next Fibonacci resistance at $828, coinciding with the 50-week EMA, implying a potential upside of around 23%. A break above this resistance would open the door for a further move toward the $950 golden ratio level, implying upside potential of 54 %.
If ASML manages to surpass the $950 mark, it could potentially retest its all-time high (ATH) at $1,110, or even break above it, continuing its long-term uptrend.
ASML Holding
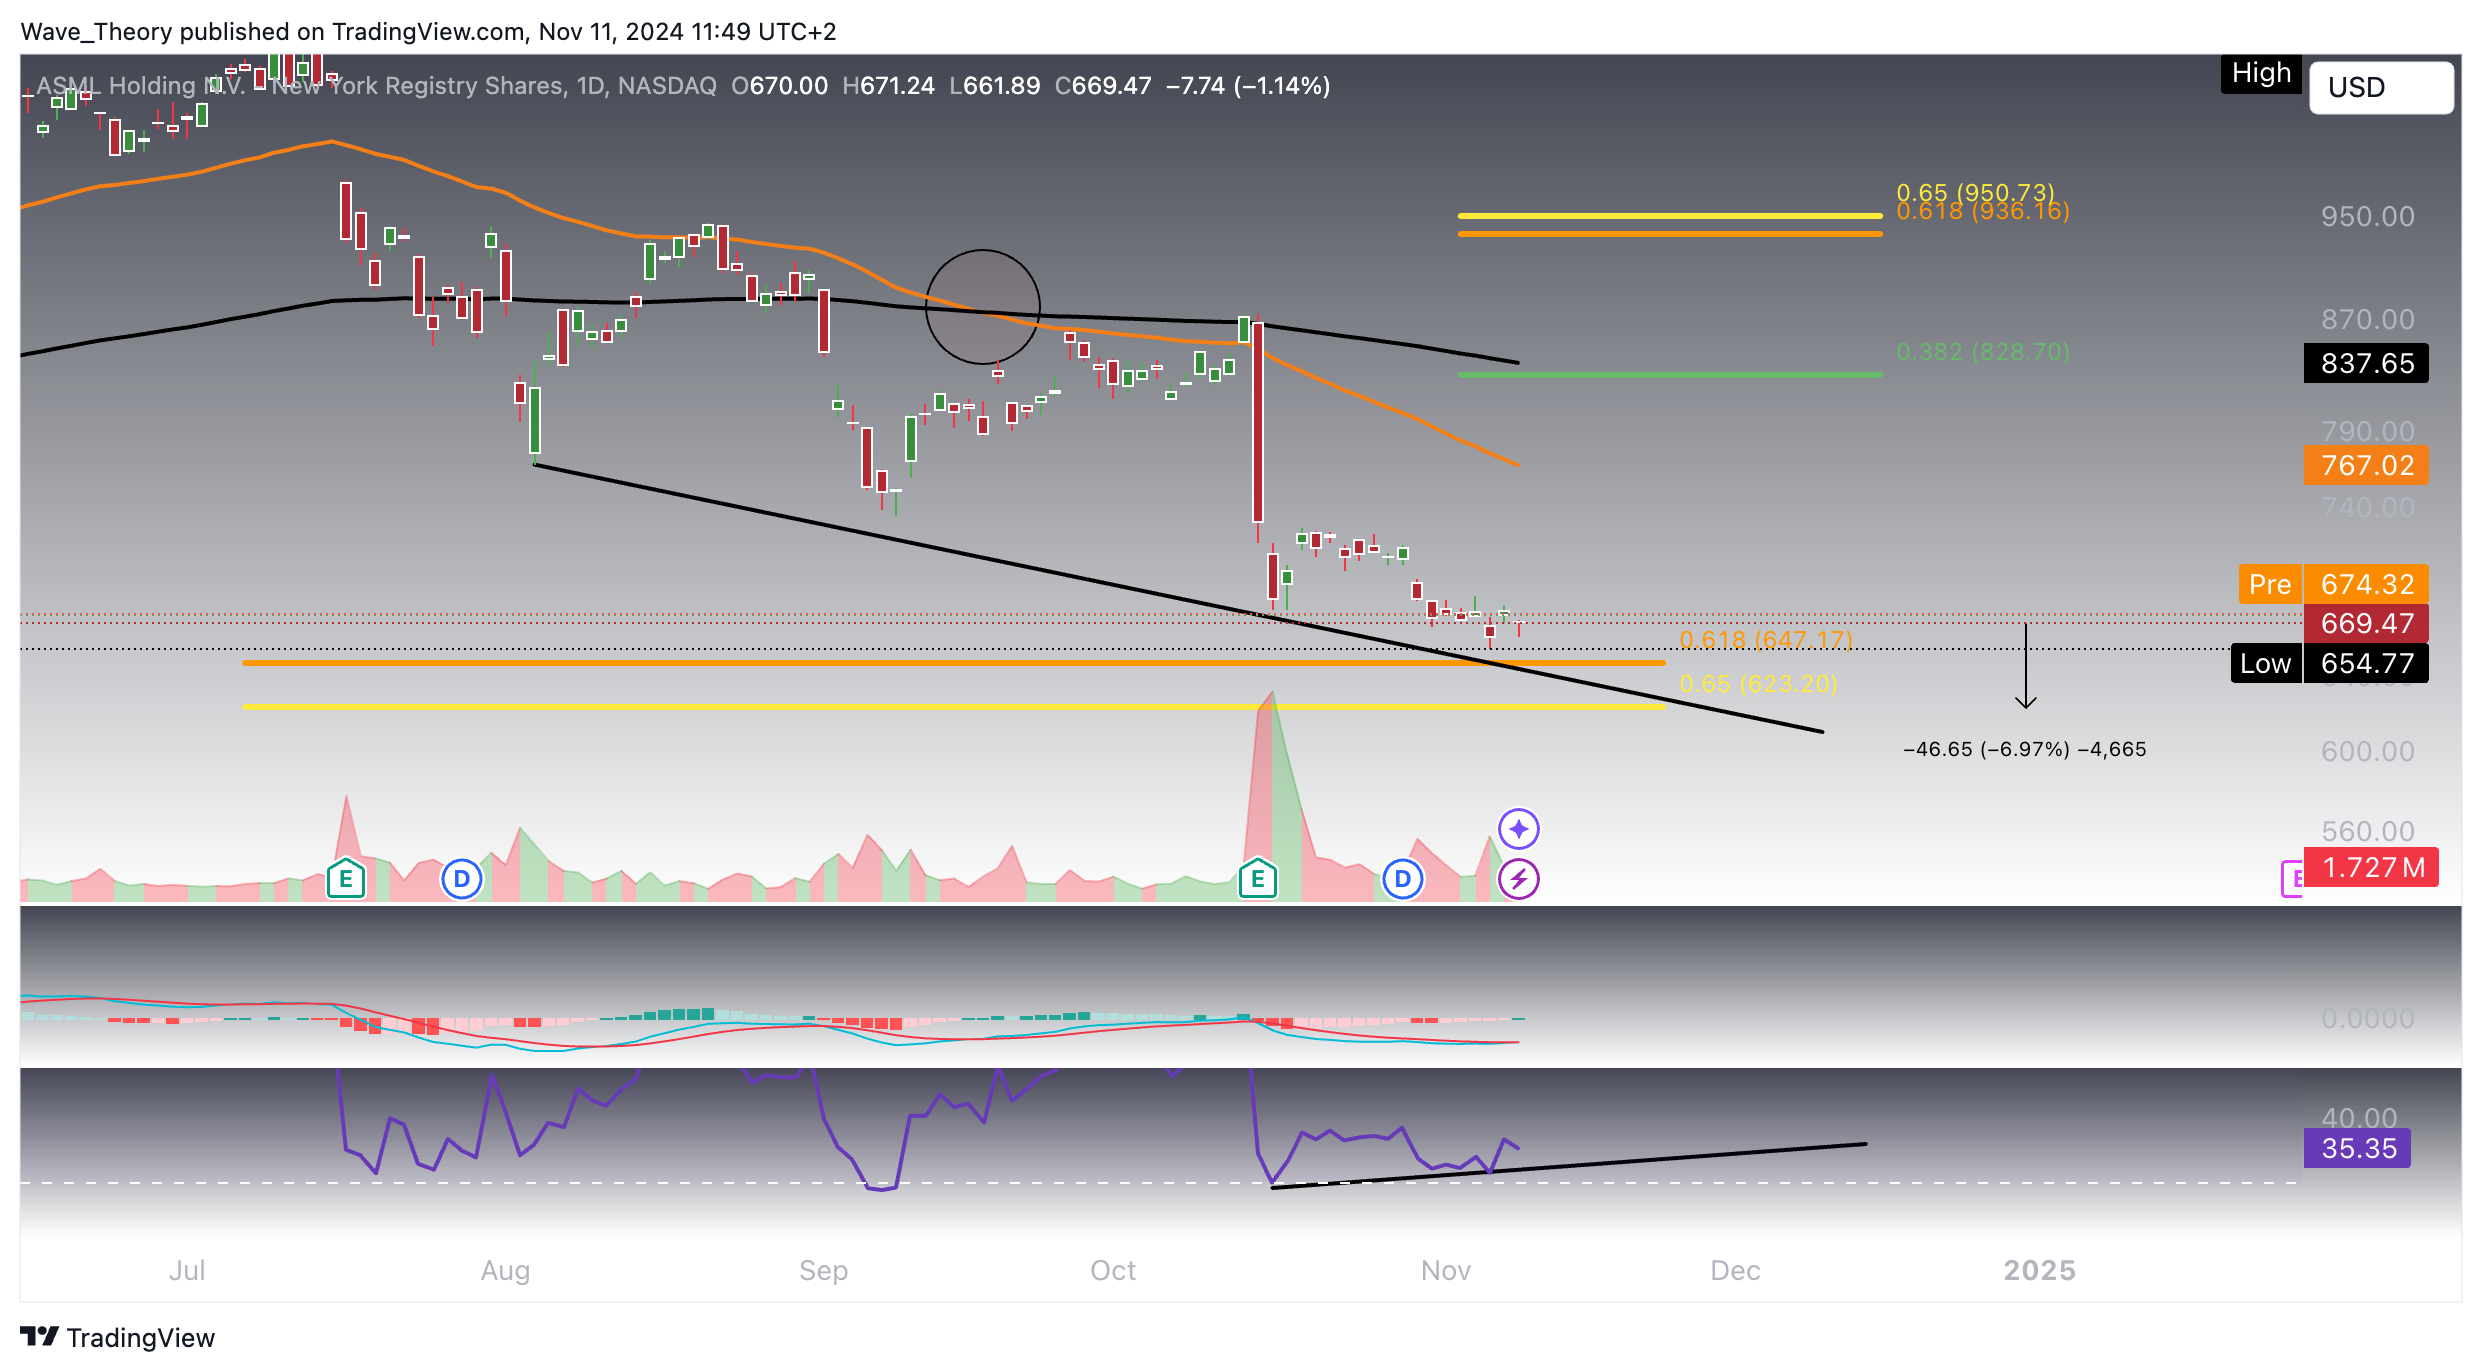
Bullish and Bearish Signals on ASML’s Daily Chart: Key Technical Indicators to Watch
In the daily chart, ASML Holding exhibits mixed signals that could significantly impact its price action. The EMAs have formed a Death Cross, which is a strong indicator of a bearish trend in the short- to medium-term. This signal typically suggests a continued downtrend, as the 50-day EMA crosses below the 200-day EMA.
Contrasting this, the RSI is signaling a bullish divergence, a pattern that could hint at a potential reversal or slowing of the current downtrend. This divergence could gain momentum as ASML reaches the lower boundary of its golden ratio support at $623, which implies a potential downward risk of around 7%. However, this level may serve as a significant support zone if the price can hold here.
Furthermore, the MACD lines are crossed bullishly, and the MACD histogram is ticking upward, suggesting that despite the bearish EMAs, momentum could shift positively in the near future. If the bullish scenario does not hold, there is a large downside risk — ASML could decline towards the 200-month EMA at $344, nearly halving its stock price. Notably, it would be the first time in ASML’s history to test this long-term support level, making it a critical point to watch.
ASML Holding
The technical landscape for ASML remains precarious, with the next few sessions likely determining whether the stock will rally from its current support or face a deeper correction. For optimistic outlooks, this may be a pivotal entry point, especially if buying interest at the current support level holds strong. A rebound here could propel the stock back toward higher resistance levels, but a failure to hold the support would open up deeper downside potential. Traders should be cautious but ready to act depending on the next market movements.
Konstantin Kaiser comes from a data science background and has significant experience in quantitative trading. His interest in technology took a notable turn in 2013 when he discovered Bitcoin and was instantly intrigued by the potential of this disruptive technology.