Bullish On Nvidia? Then Don’t Miss Out On This Stock

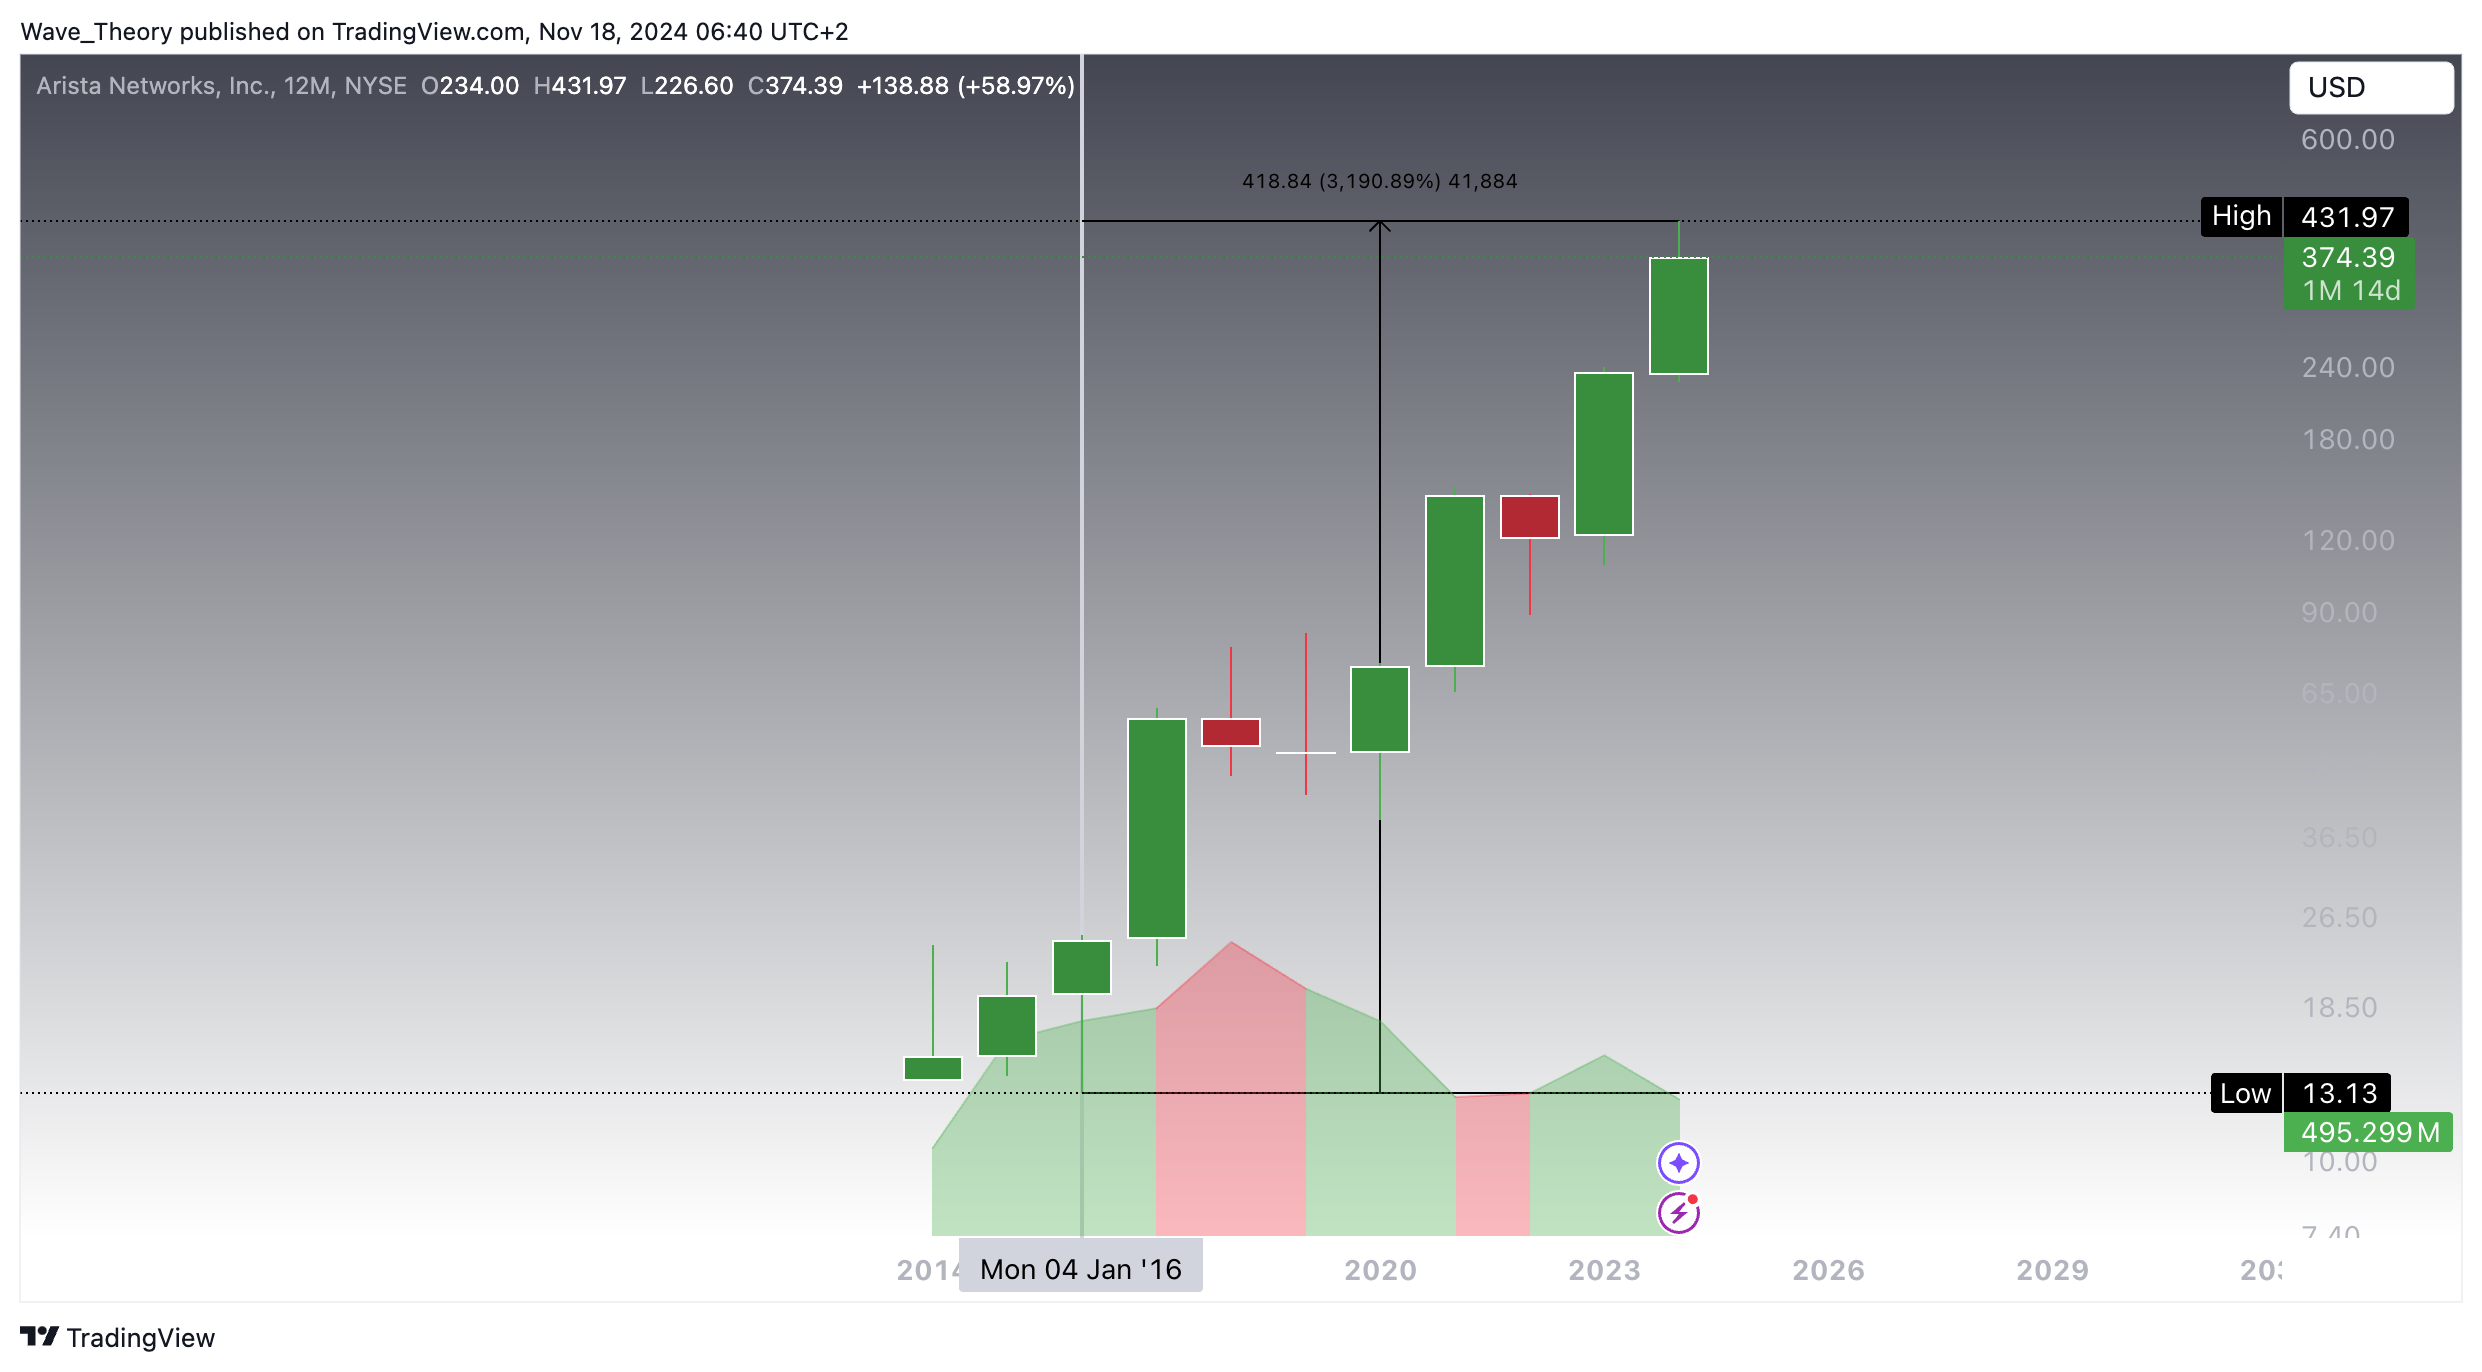
Arista Networks (ANET) Stock Surges Nearly 3,200% Over the Past Eight Years
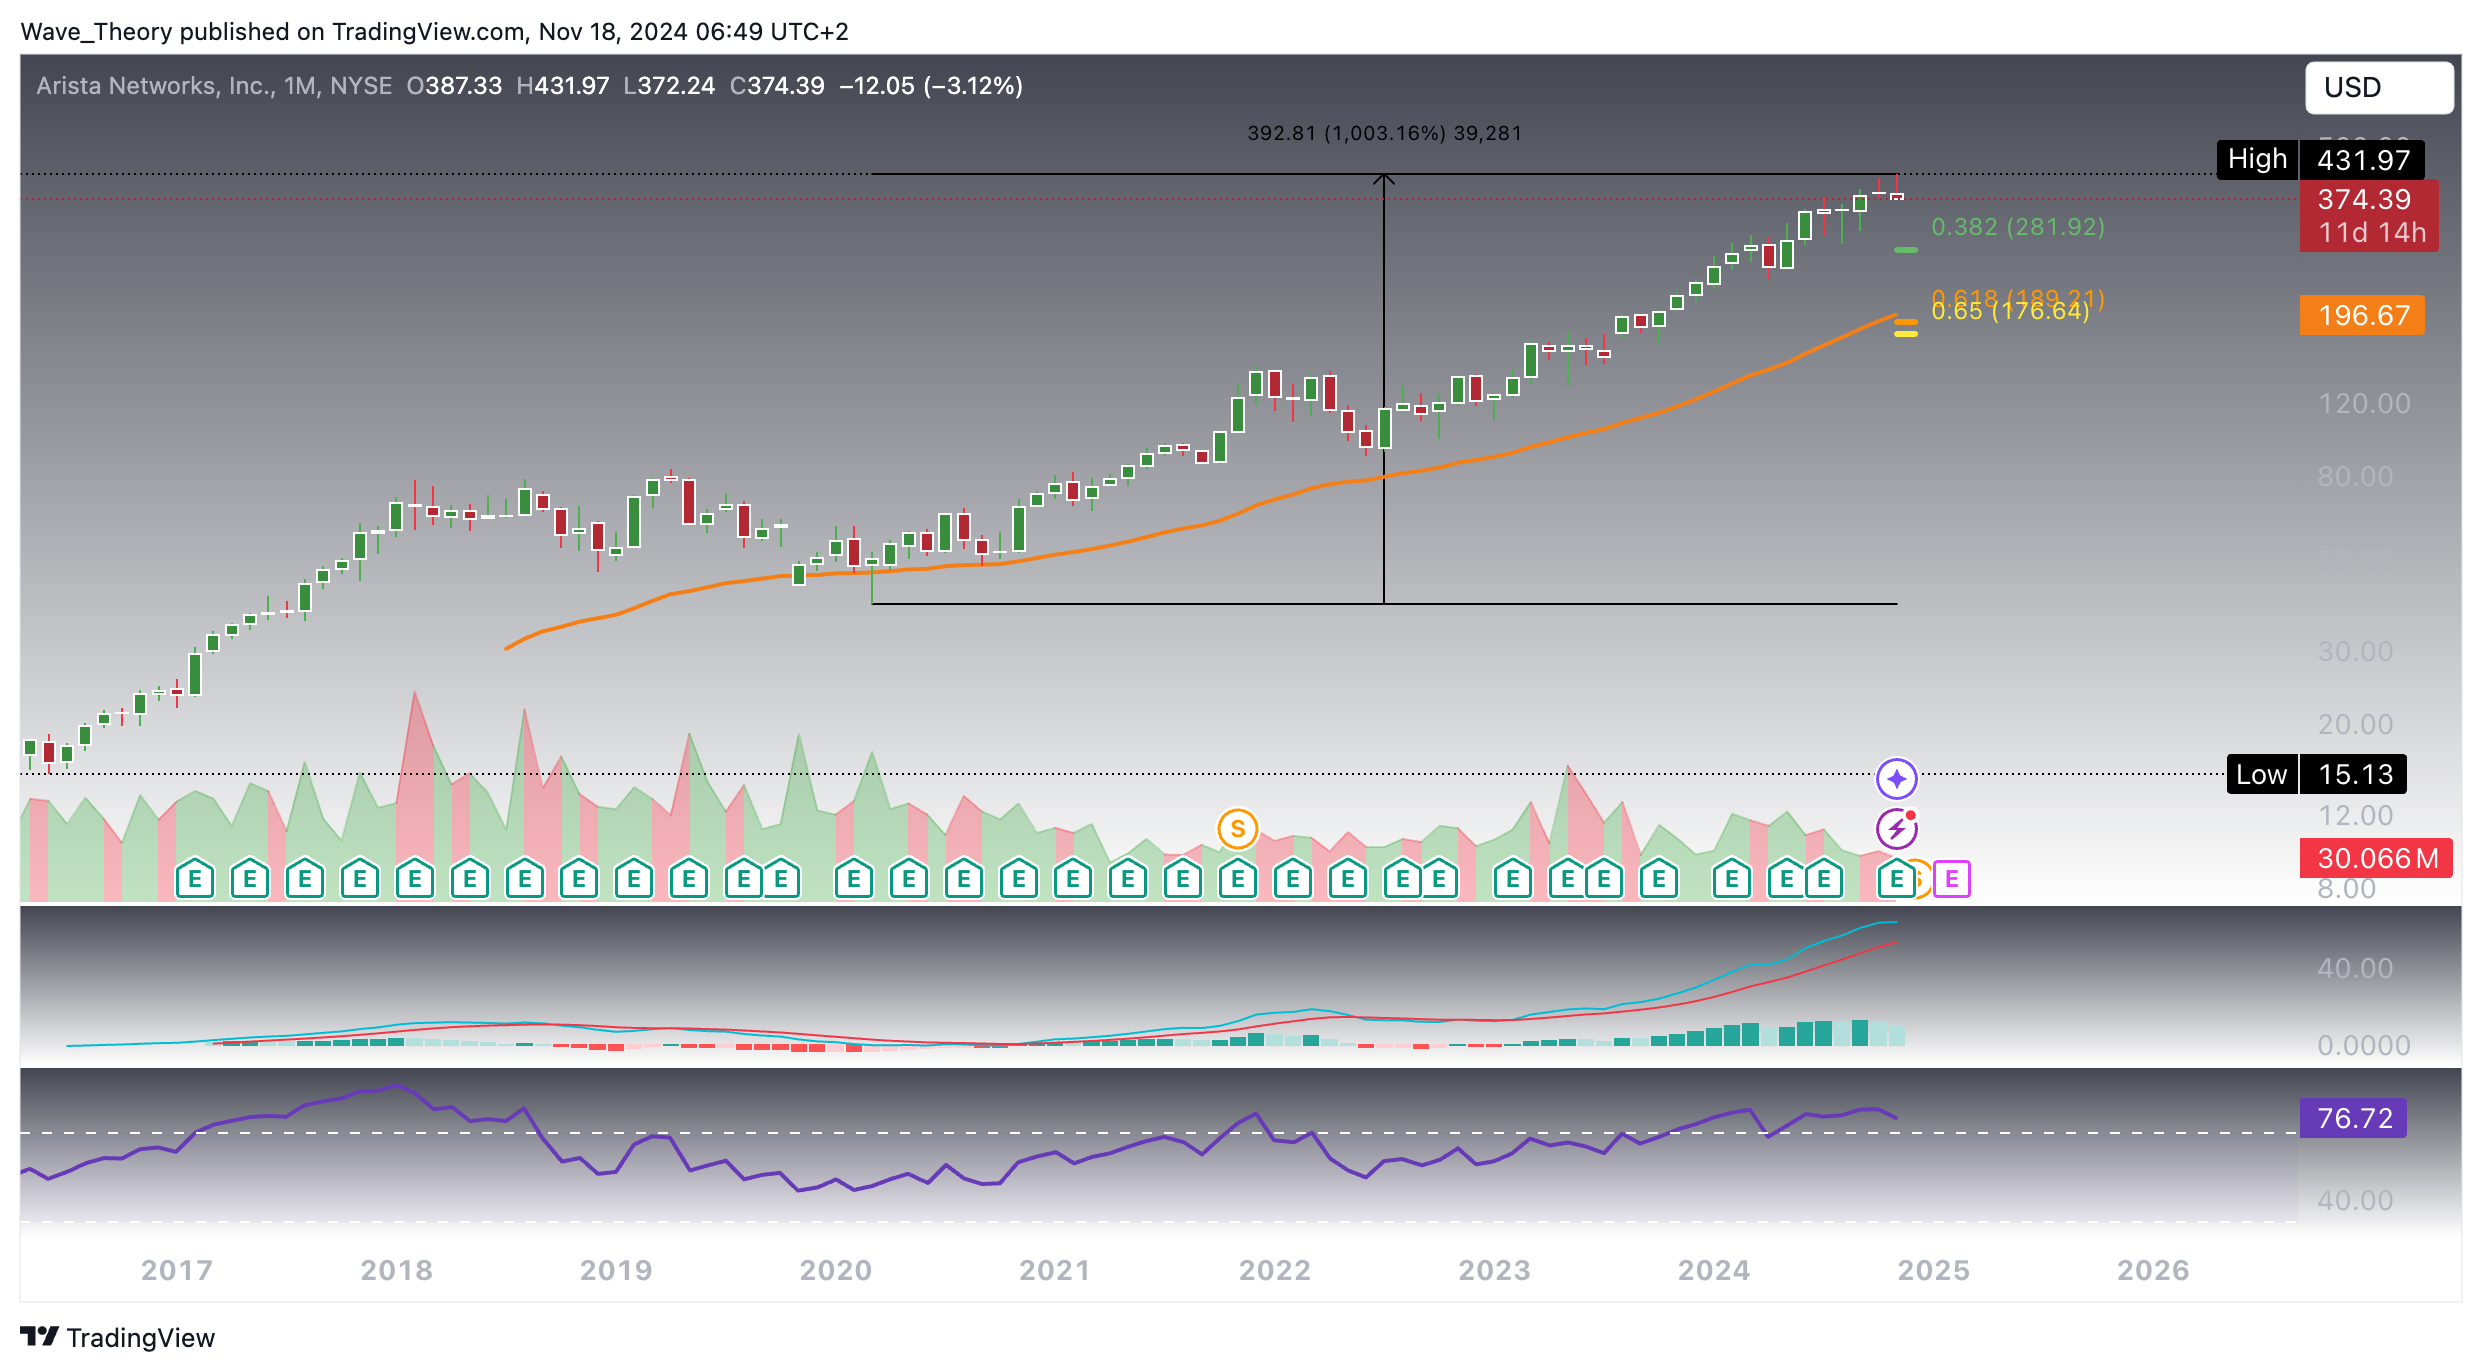
Since bottoming out slightly below the 50-month EMA support, Arista Networks (ANET) stock has rallied by over 1,000%. Throughout this substantial uptrend, the stock has consistently held above the 50-month EMA, showcasing strong technical resilience. However, the current market dynamics suggest the potential for a corrective phase. A downward move toward the next key Fibonacci support at $282 could be on the horizon. If this level fails to hold, further retracement may occur, targeting the golden ratio between $176 and $197, where the 50-month EMA offers additional support.
Moreover, momentum indicators signal growing caution. The MACD histogram has been ticking bearishly lower since last month, and the RSI is currently in overbought territory, suggesting the stock might be overextended. While the MACD lines remain bullishly crossed, these early warning signs hint that ANET could face increased selling pressure in the near term. Monitoring these key technical levels is crucial for anticipating future price action.
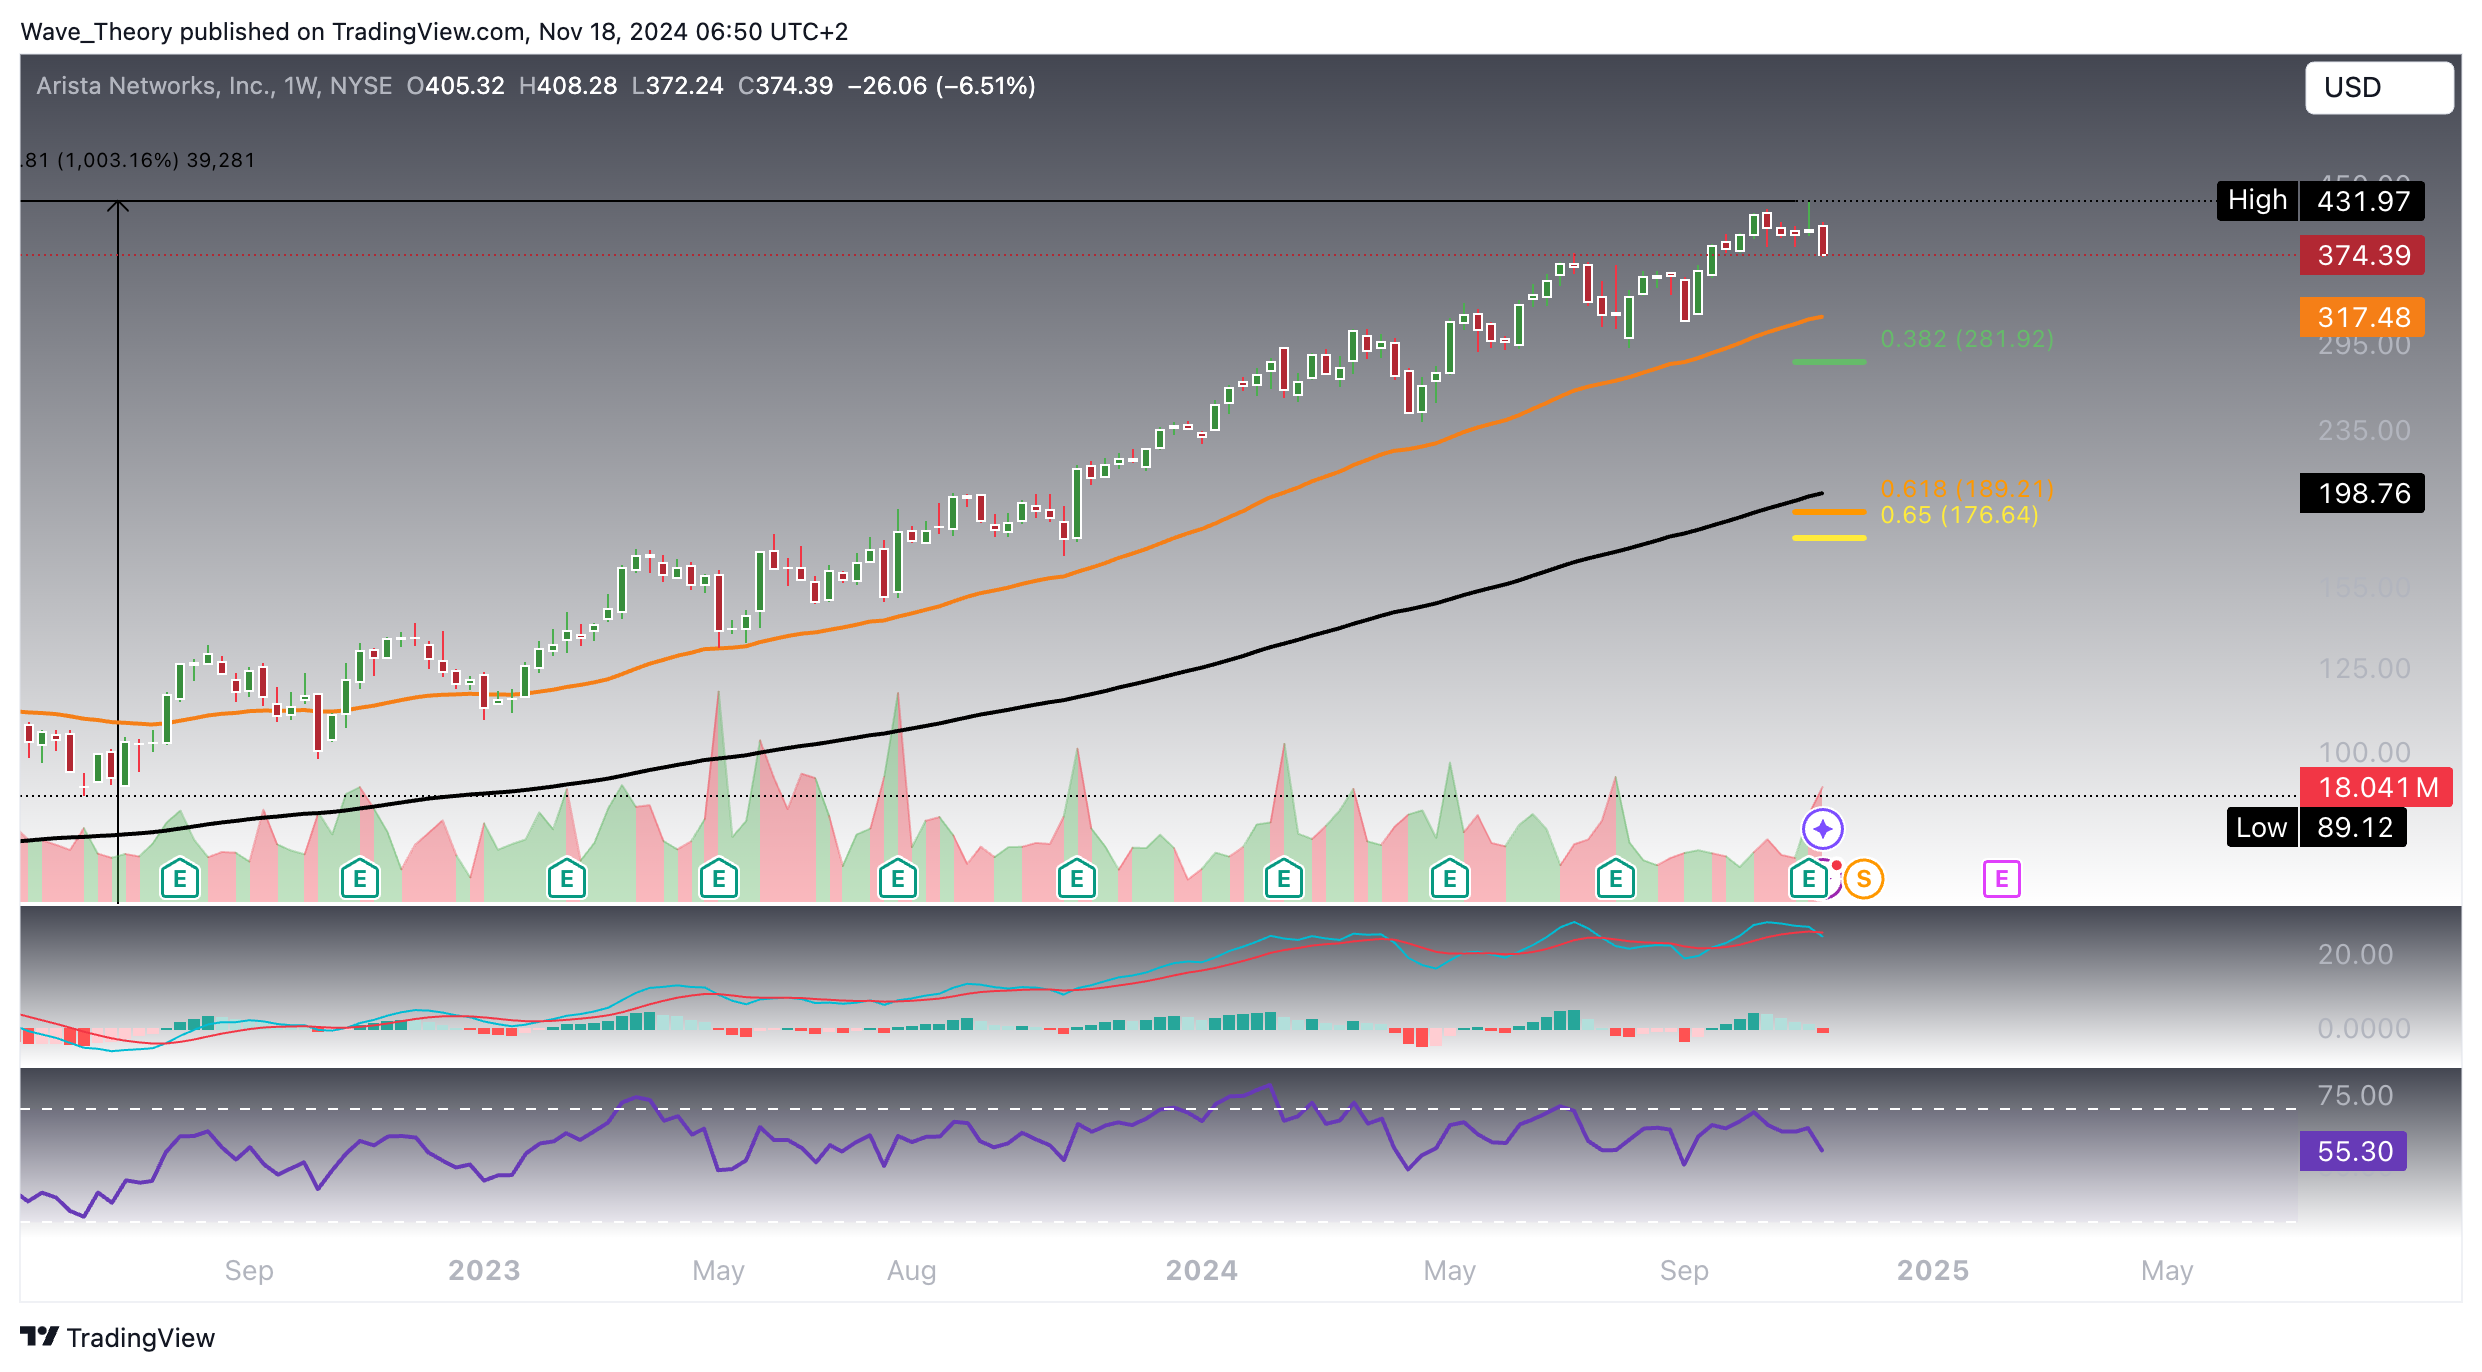
The weekly chart for Arista Networks (ANET) confirms a bearish outlook in the short to medium term. The MACD lines are on the verge of a bearish cross, while the MACD histogram has been trending lower for several weeks, signaling diminishing momentum. Furthermore, the RSI continues to show a bearish divergence, indicating weakening strength despite price movements to the upside.
However, there is a golden crossover of the EMAs, which keeps the mid-term trend bullishly intact, suggesting that while short-term pressure builds, the overall upward trend remains confirmed.
In terms of support, ANET finds immediate relief at the 50-week EMA, currently sitting at $317.5. This level will be key to watch before any potential downside move toward the next Fibonacci support levels. If this $317.5 support holds, it could lead to a rebound, but failure to maintain this level may result in further declines.
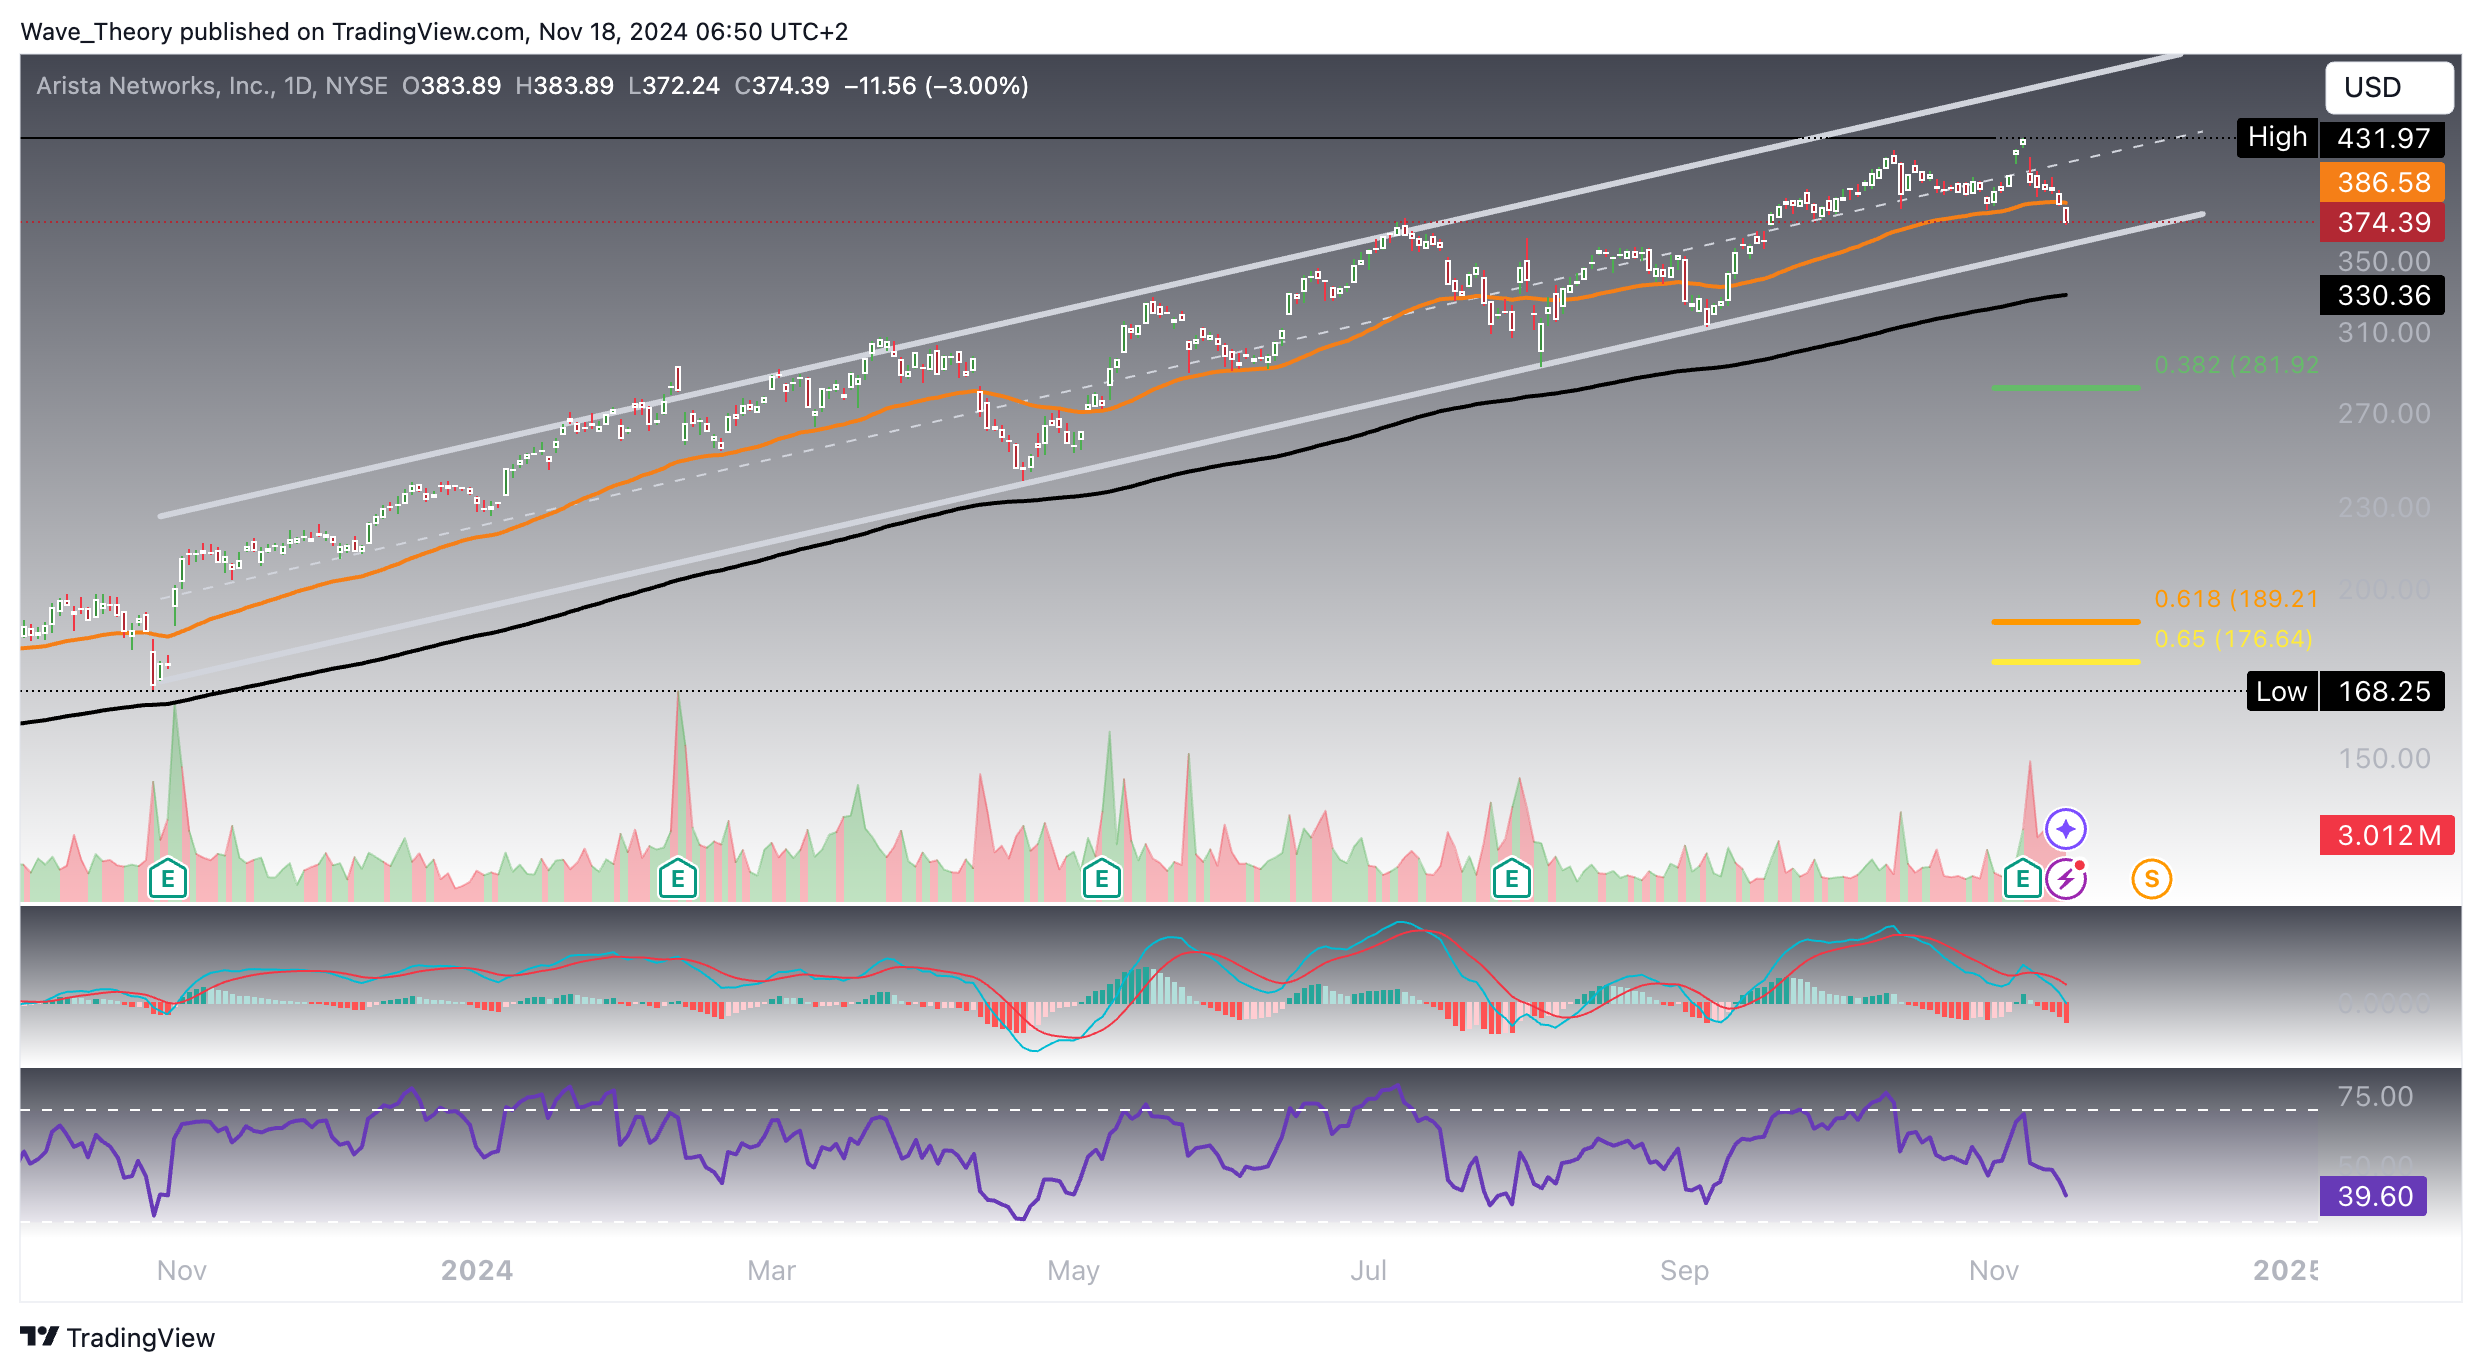
More Bearish Signals In The Daily Chart Of Arista Networks (ANET)
Weakening Bullish Momentum Despite Intact Golden Crossover
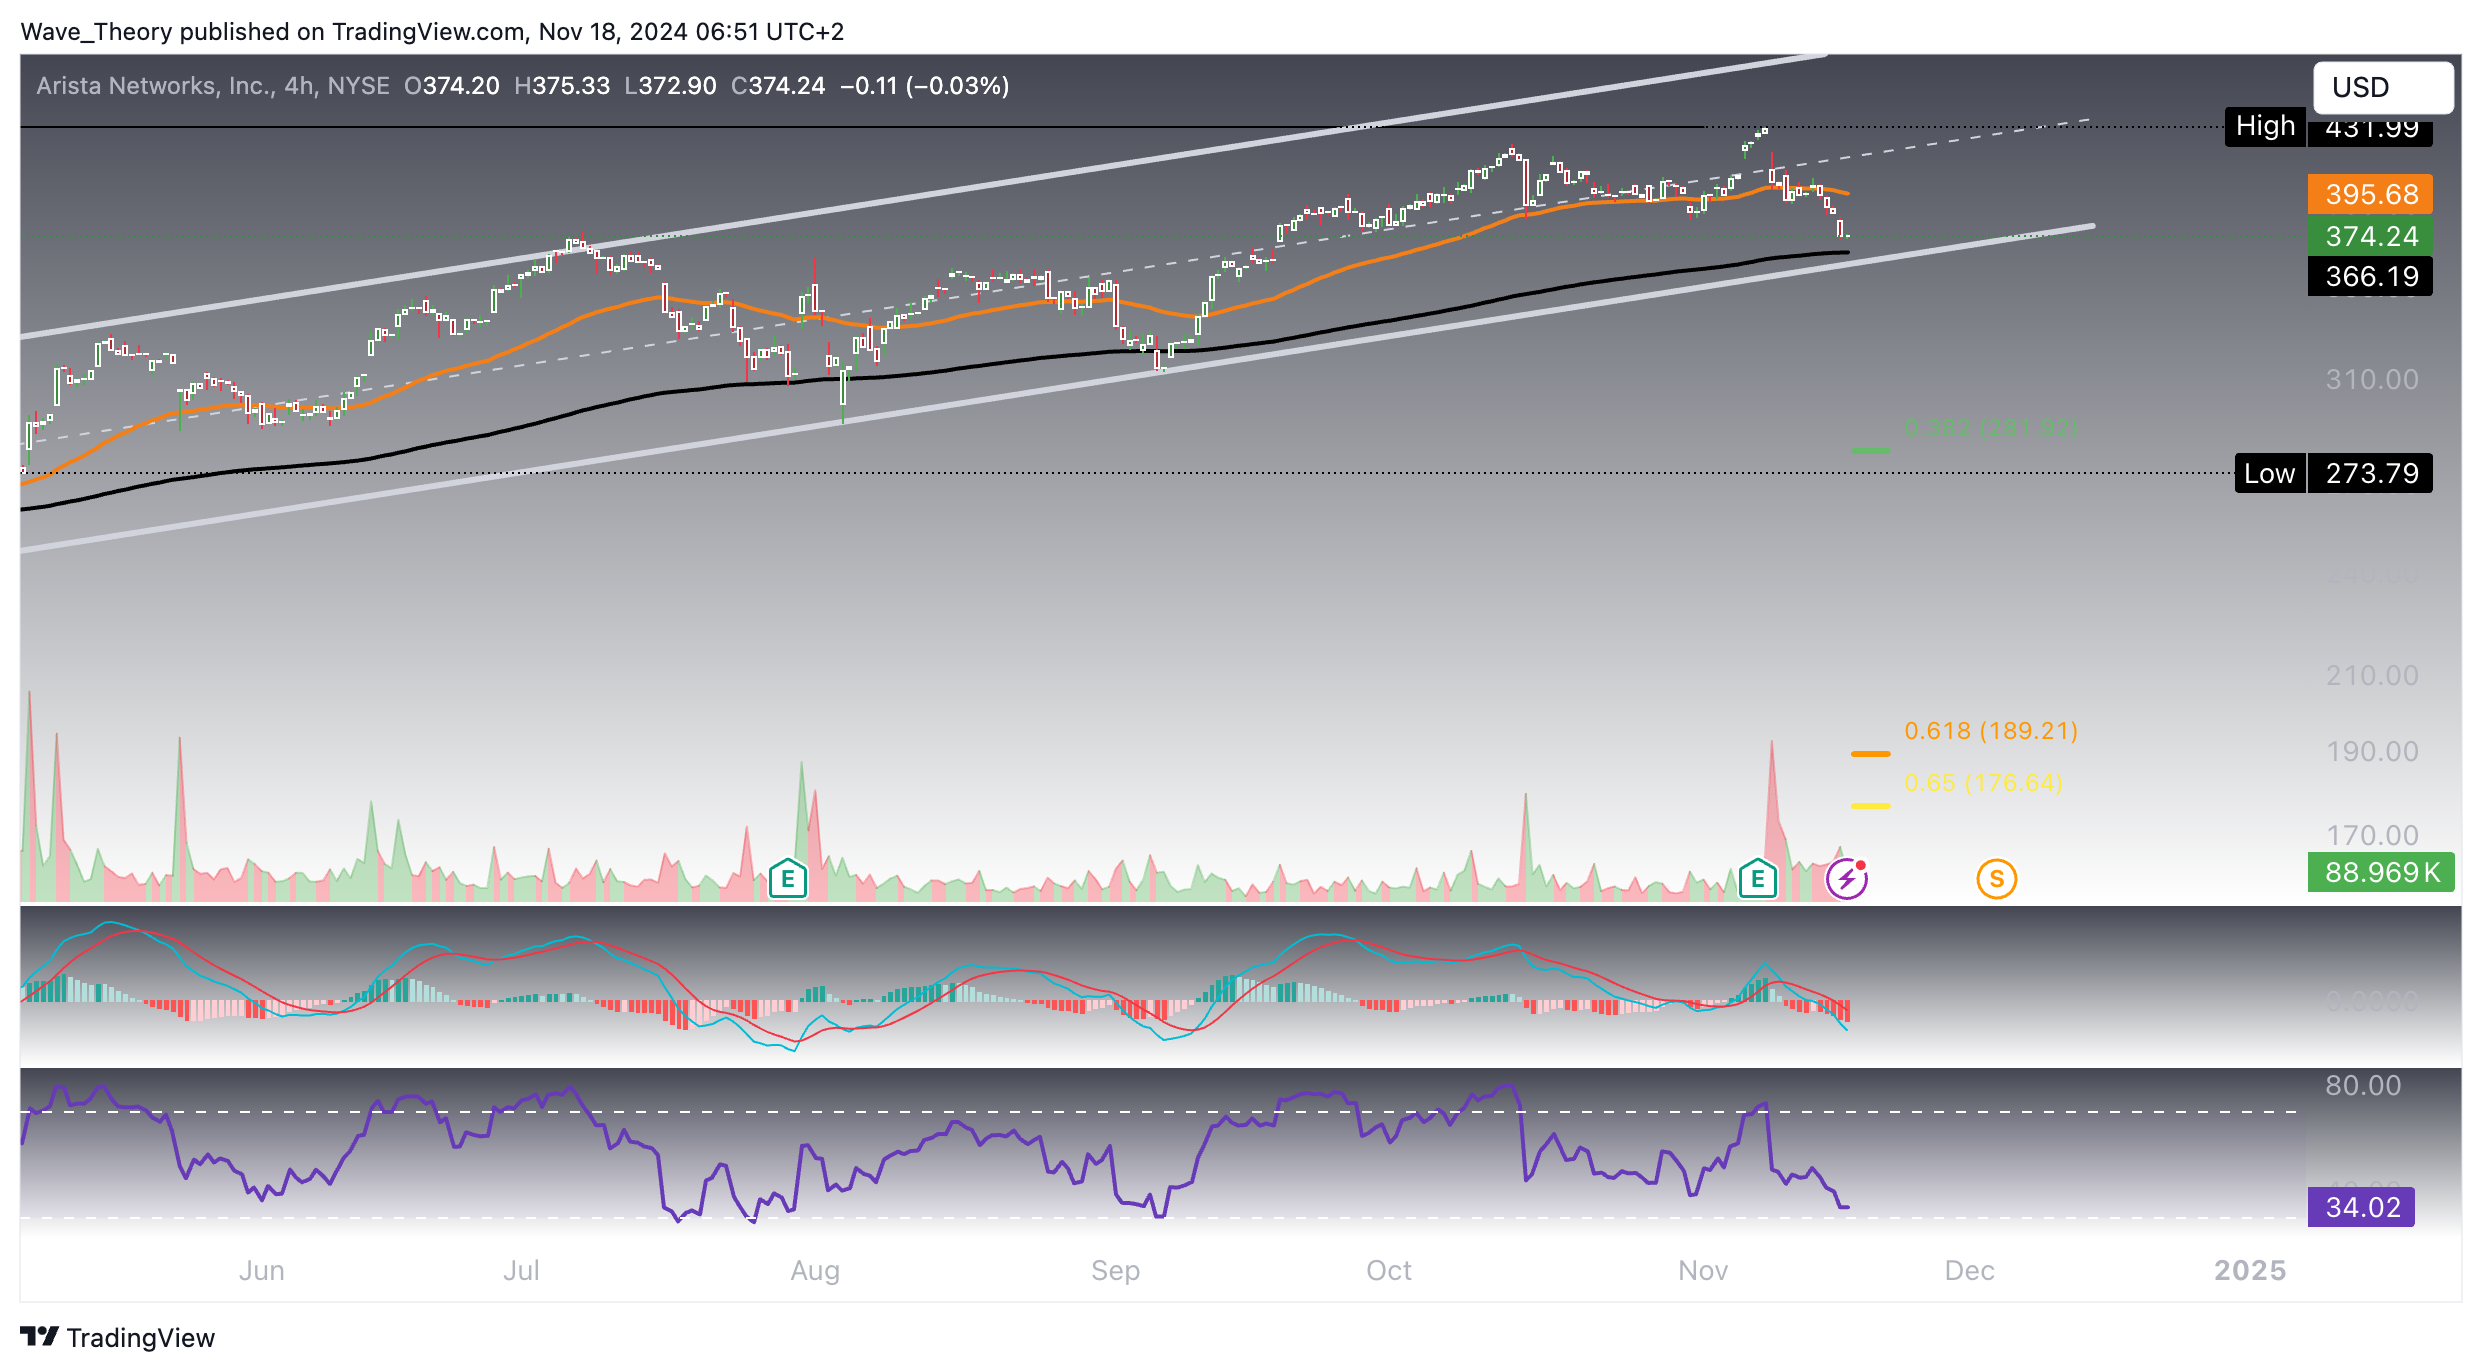
The 4-hour chart for Arista Networks (ANET) mirrors the larger timeframes, with an intact golden crossover of the EMAs, indicating that the trend remains bullish. However, the short-term signals are less encouraging. The MACD remains bearish, with the lines crossed to the downside and the histogram reflecting continued downward momentum. Meanwhile, the RSI is neutral, providing no clear bias.
Key support lies at the 200-period 4-hour EMA, which coincides with the lower trendline of the parallel upward channel. This area could act as a pivotal reversal point for the corrective phase. However, if this support is broken bearishly, it would likely signal further downside, potentially accelerating a move toward lower Fibonacci levels. Traders should watch this key support closely, as its breach could mark a significant shift in ANET’s short-term direction.
- Check out our free forex signals
- Follow the top economic events on FX Leaders economic calendar
- Trade better, discover more Forex Trading Strategies
- Open a FREE Trading Account
- Read our latest reviews on: Avatrade, Exness, HFM and XM
Related Articles
Sidebar rates
