
Following last night’s US-UK trade deal, Rolls-Royce Holdings PLC (RYCEY) saw a notable 7% surge in its stock price. Over the past five weeks, the stock has soared by approximately 35.5%, reflecting growing investor confidence amid the positive trade developments.
Rolls-Royce Stock (RYCEY) Sees 1,434% Surge: Technical Setup Points to Further Upside
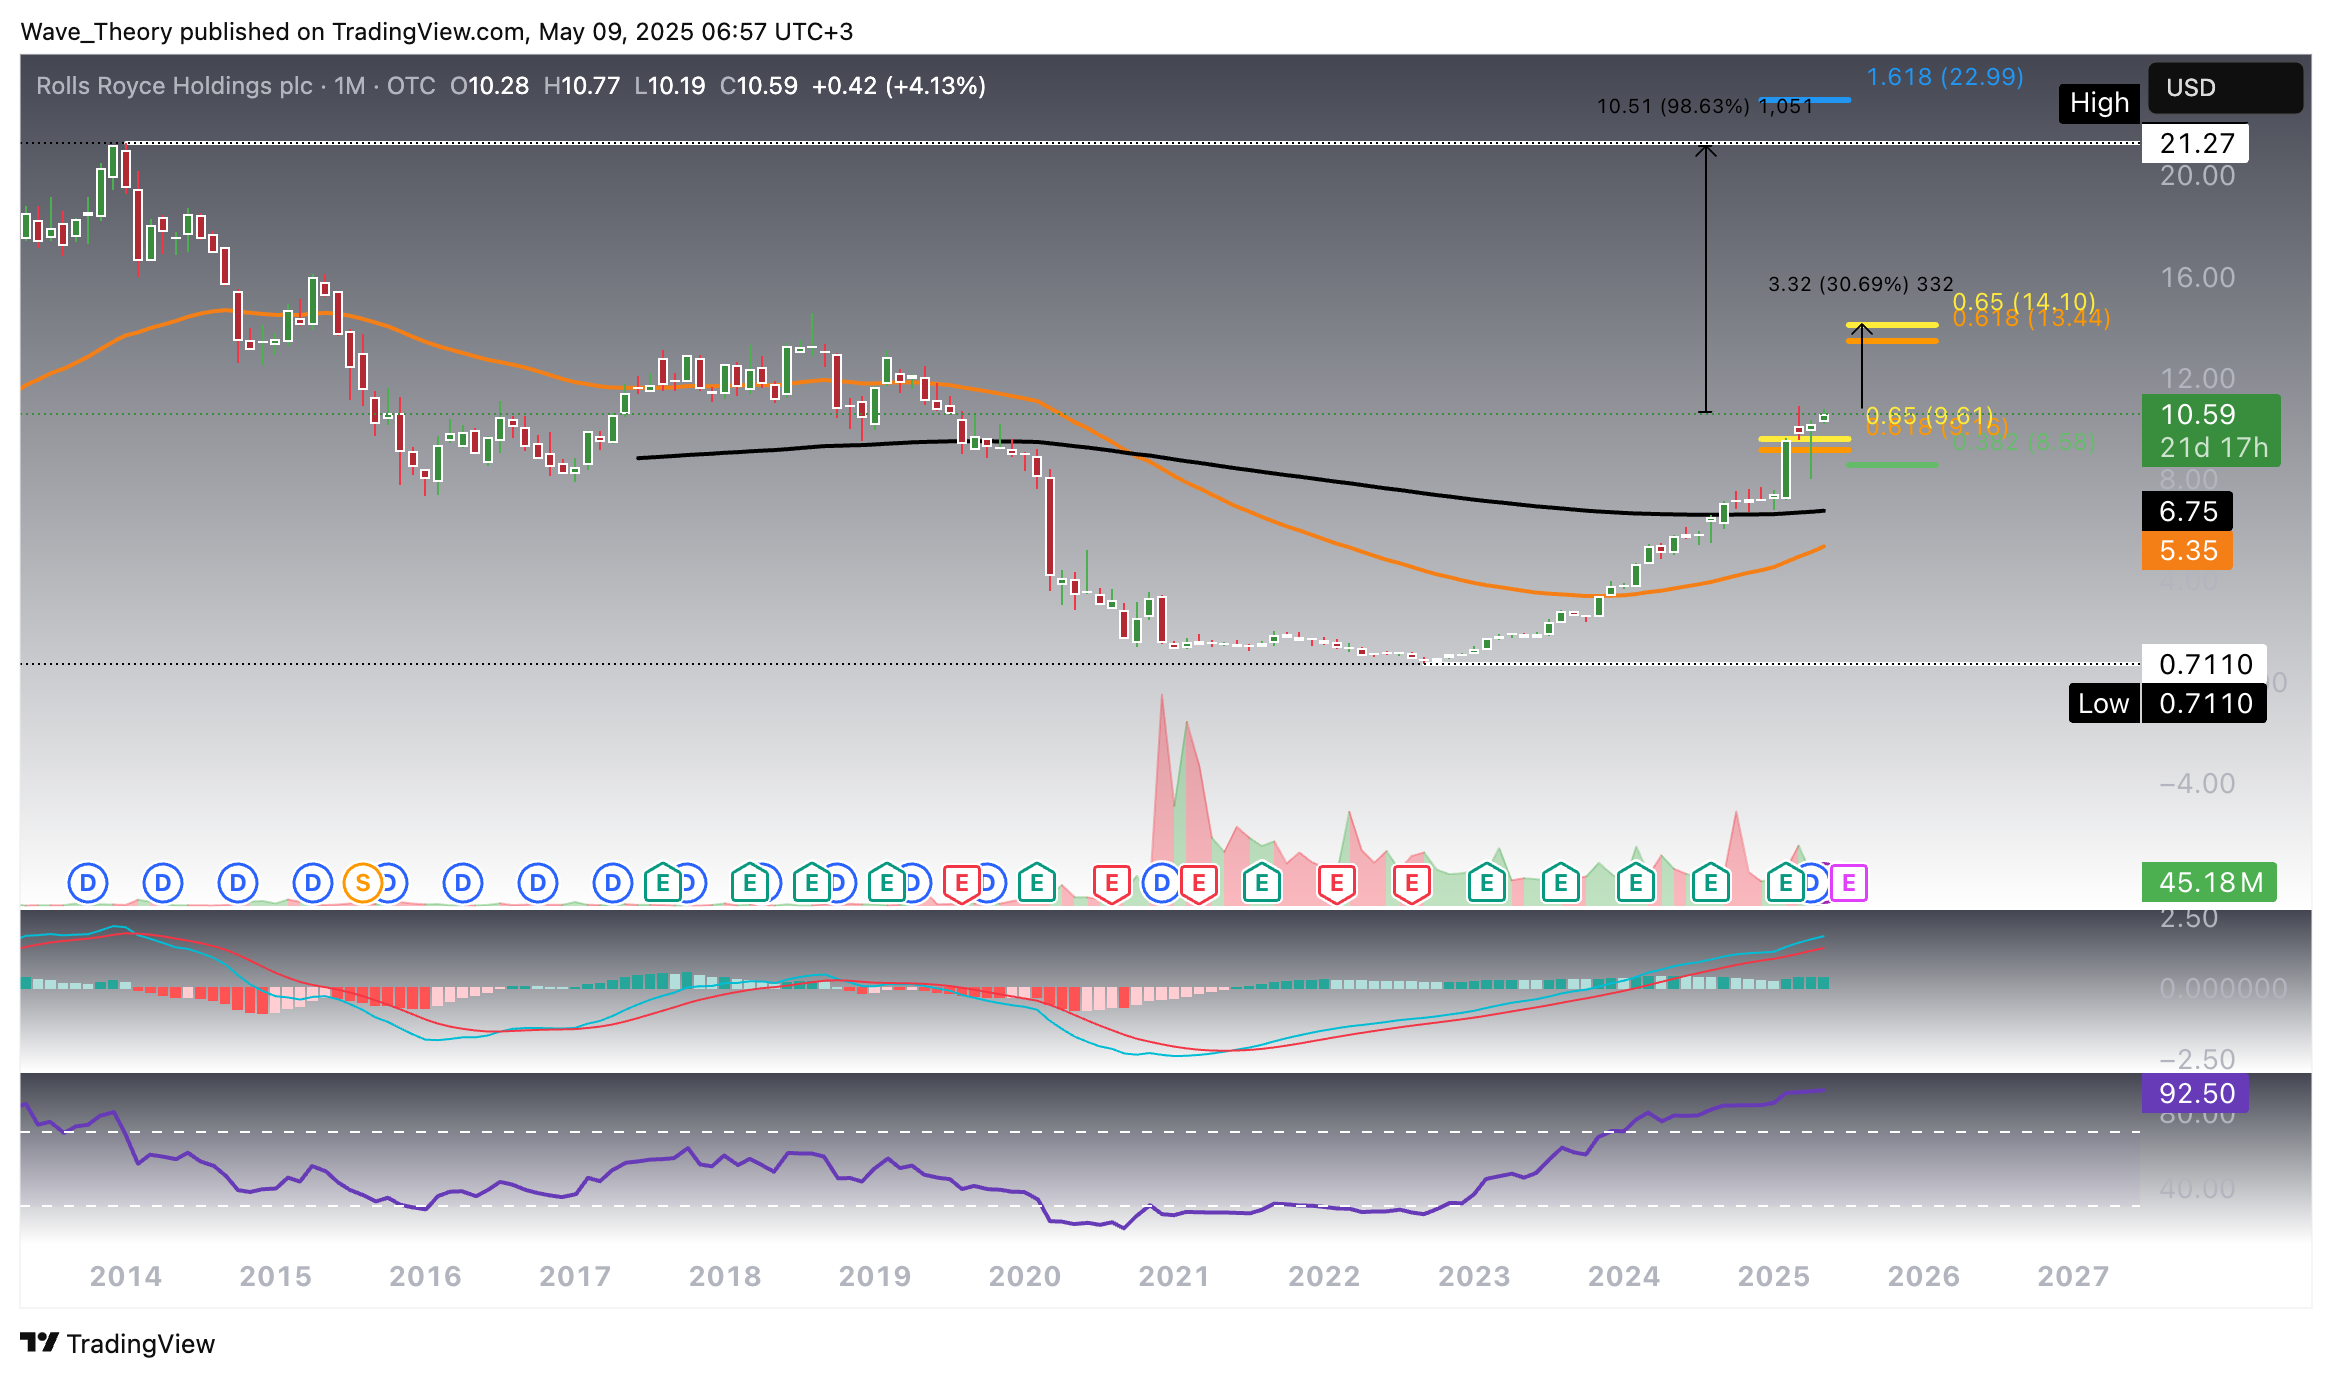
Over the past 2.5 years, Rolls-Royce stock (RYCEY) has experienced an extraordinary rally, surging 1,434% from $0.70 to nearly $11. This remarkable price action is underpinned by strong bullish momentum across several technical indicators.
The MACD histogram has been consistently ticking higher over the last four months, confirming ongoing bullish momentum, while the MACD lines remain in a bullish crossover. This setup suggests the stock is still in a positive trend phase. However, the RSI is currently in overbought territory, though it’s not showing any signs of bearish divergence, which implies that the uptrend could persist without immediate exhaustion.
Regarding moving averages, the EMAs are on the cusp of executing a golden crossover, which would provide additional confirmation of bullish continuation. That said, the EMAs still reflect a death cross, indicating a bearish long-term trend, which could be a potential risk factor if the stock fails to hold recent levels.
From a structural perspective, Rolls-Royce has successfully broken both the 0.382 Fibonacci level at $8.60 and the golden ratio at $9.60, positioning the stock for a potential 31% rise towards the final golden ratio level at $14. Should the stock break above $14, it would invalidate the corrective phase, signaling a resumption of the uptrend. In this scenario, Rolls-Royce could then aim for a doubling of its stock price, potentially reaching its all-time high (ATH) at $21.30.
This setup offers a compelling bullish case for the stock, with significant upside potential in the short-to-medium term. However, the risks associated with the EMAs and RSI warrant cautious monitoring of key levels.
Cautious Signals: Bearish Divergence Looms on the Weekly Chart
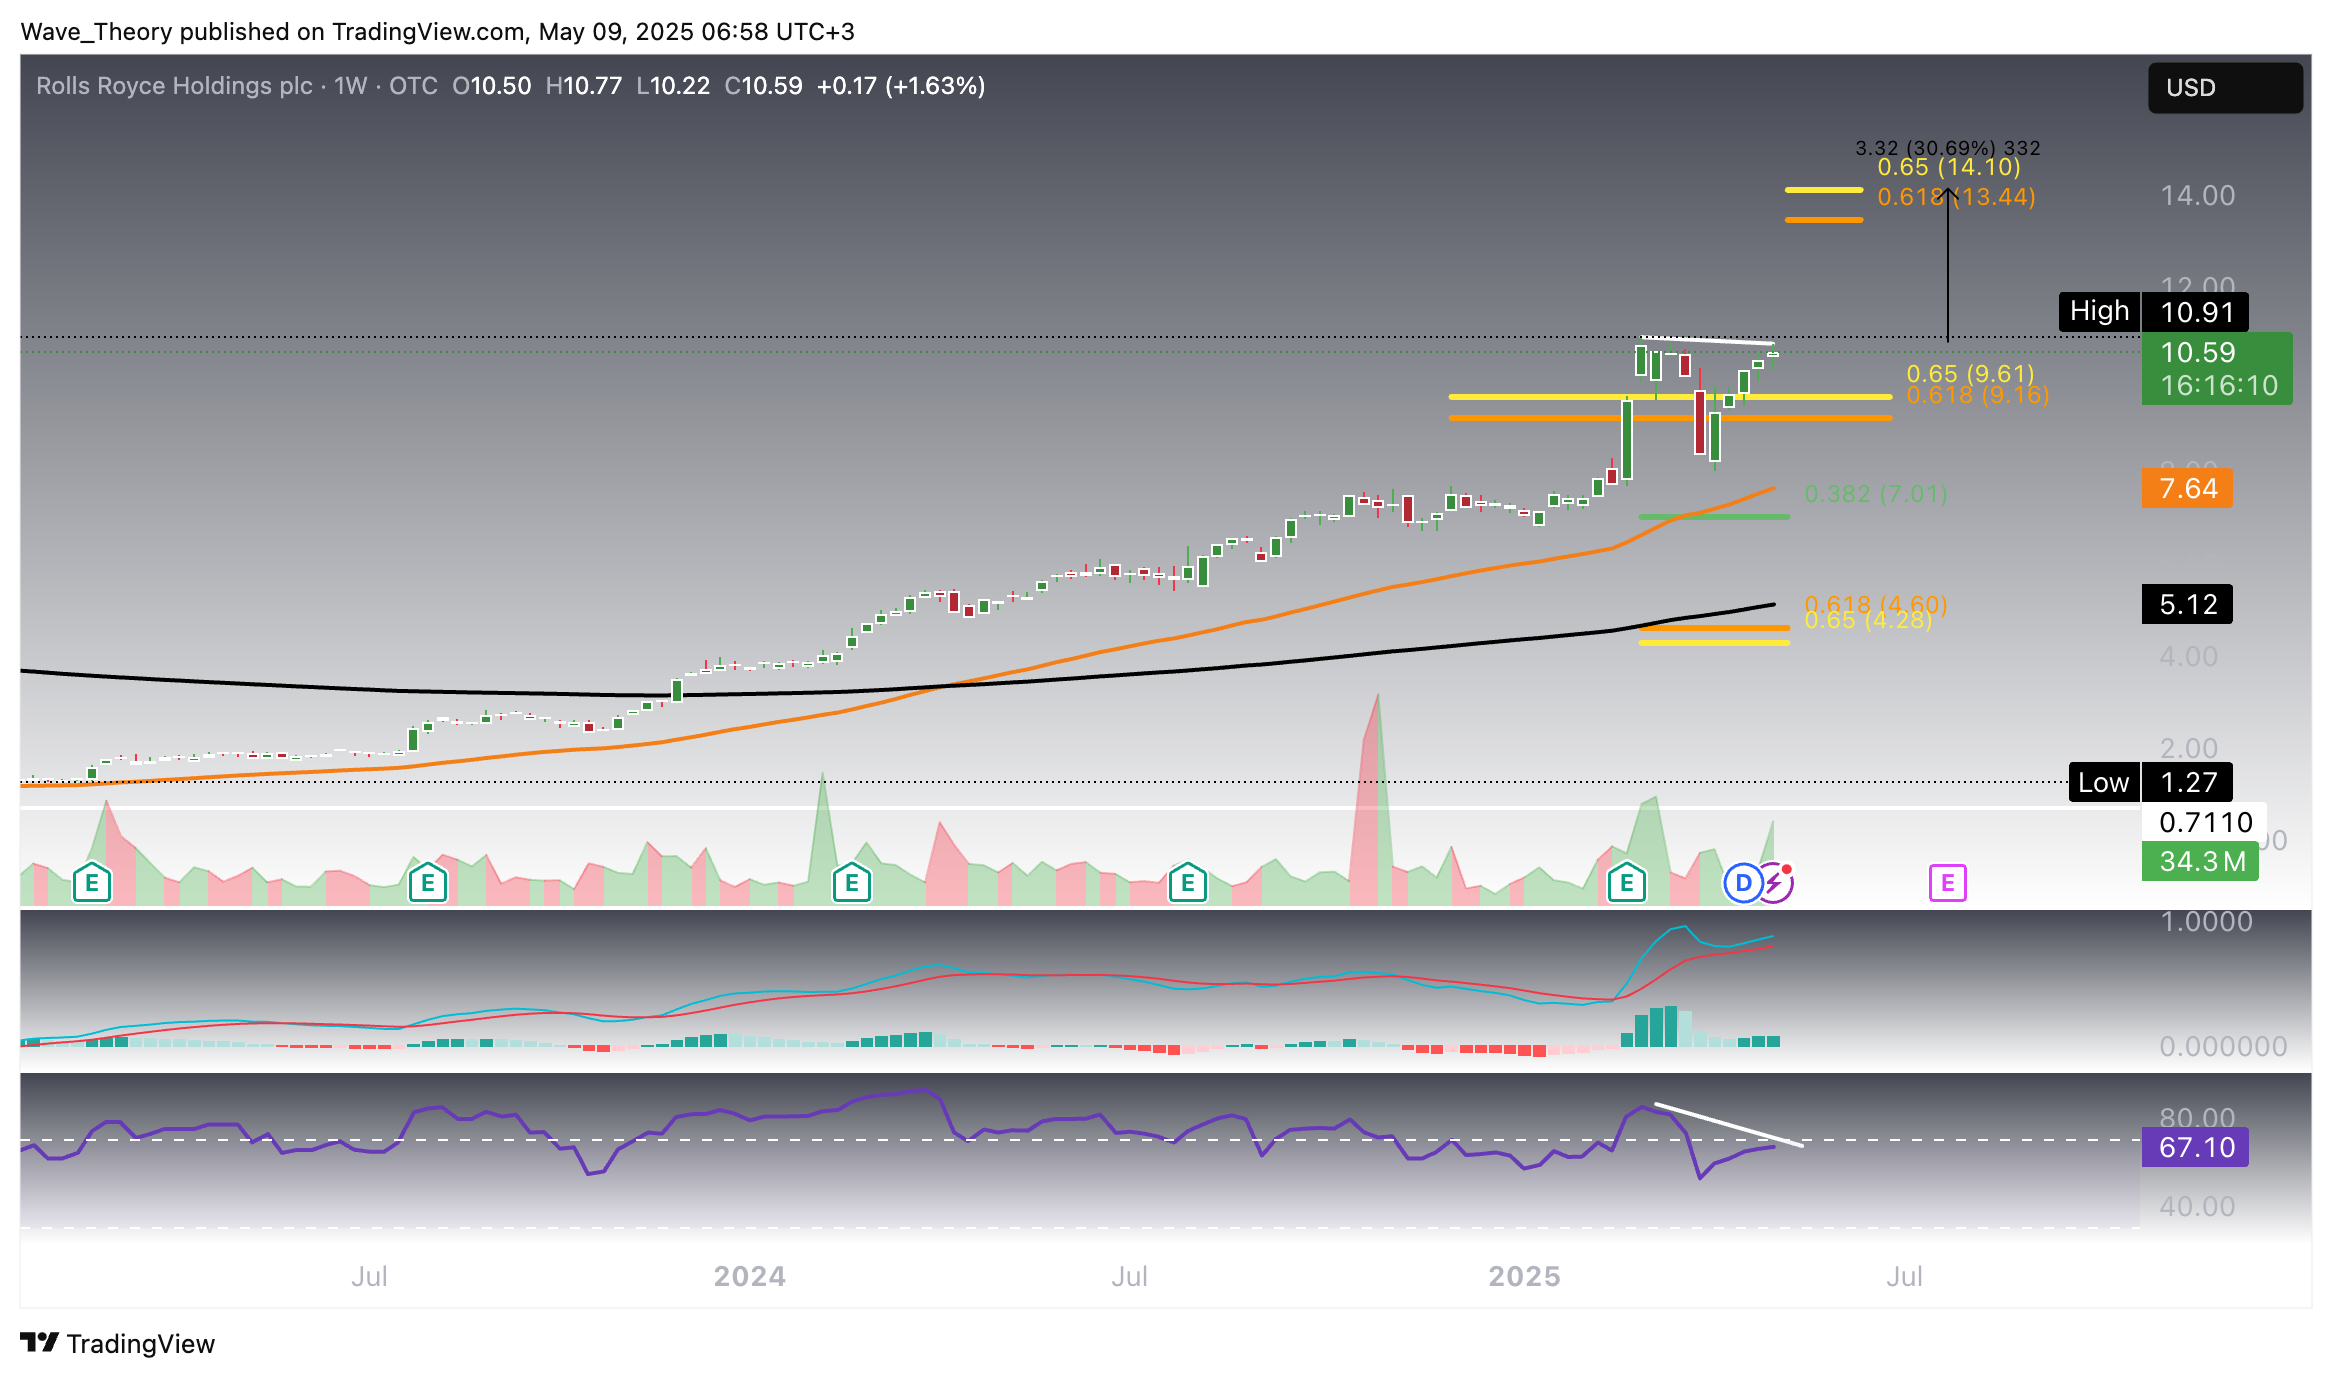
On the weekly chart, Rolls-Royce stock shows strong bullish signals. The EMAs have executed a golden crossover, confirming a bullish mid-term trend. Additionally, the MACD lines remain bullishly crossed, and the MACD histogram has been rising for the past three weeks, further supporting the positive momentum.
However, caution is warranted, as the RSI could potentially form a massive bearish divergence if the stock continues to surge in the short term. This divergence would signal a potential weakening of the current rally, despite the bullish technical indicators. Monitoring this development will be key to assessing whether the upward momentum is sustainable or if a correction could be imminent.
Daily Chart Mirrors Weekly Chart: Bullish Trend with Caution Ahead
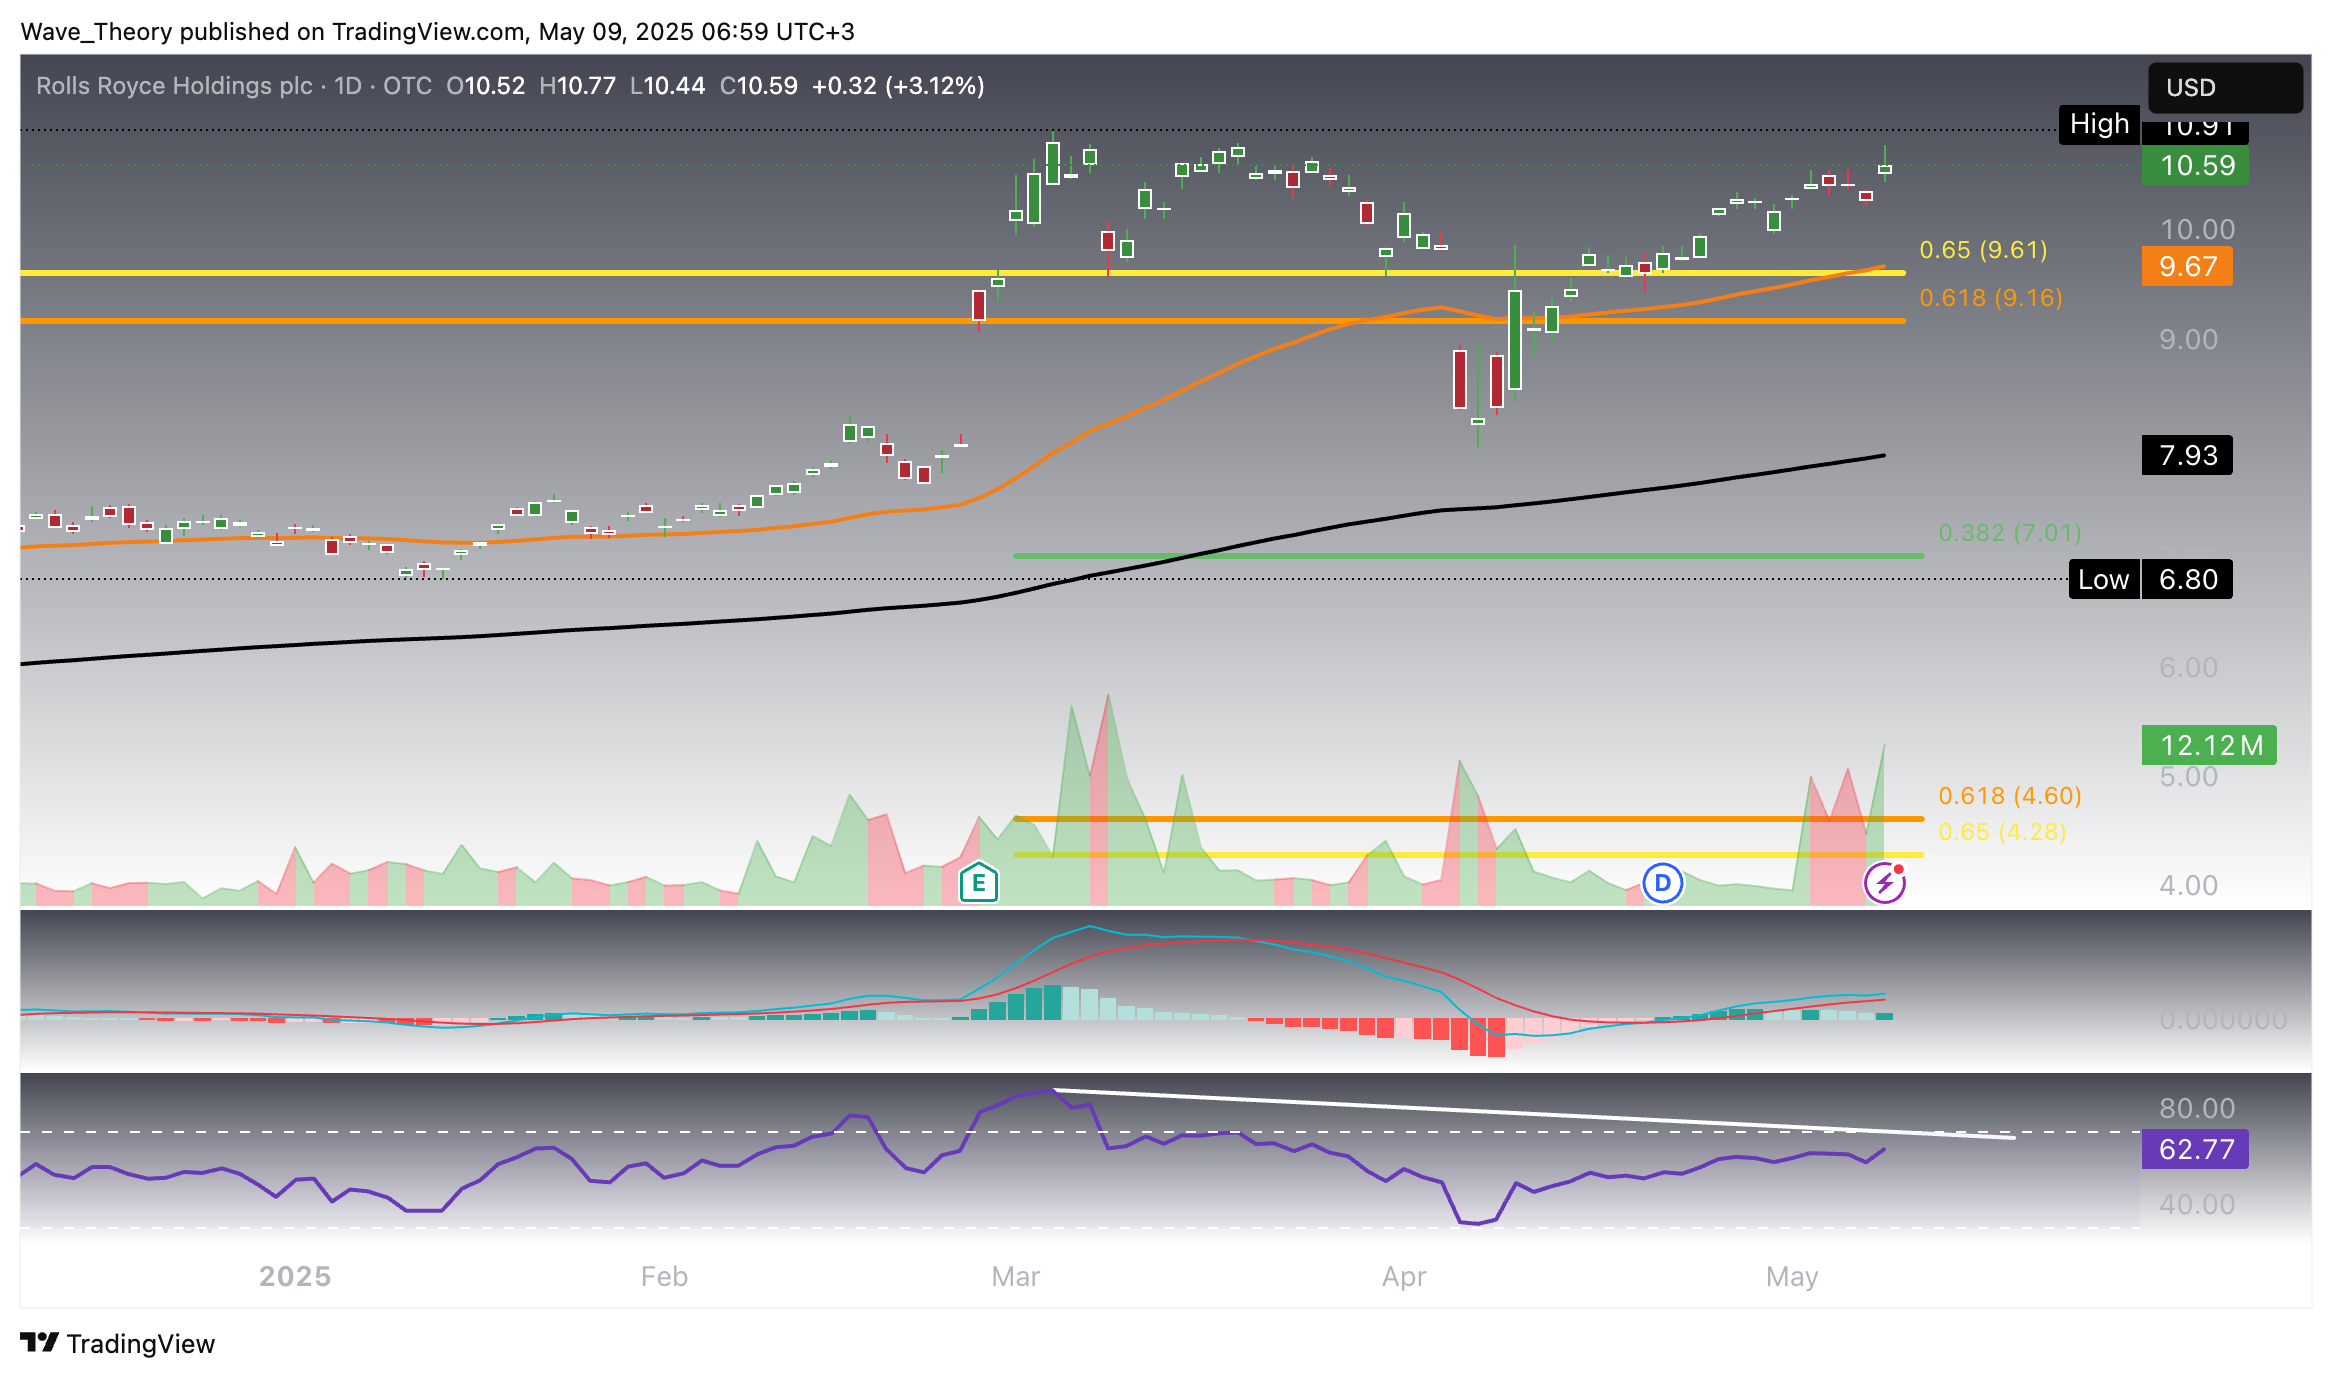
On the daily chart, Rolls-Royce stock presents a similar bullish setup. The MACD lines and EMAs are both bullishly crossed, signaling a continuation of the uptrend in the short- to medium term. Additionally, the MACD histogram is ticking higher, reinforcing the positive momentum.
However, the RSI is approaching a critical point. If the stock price surpasses its recent high of $10.91 next week, there is a risk of forming a bearish divergence. This could indicate weakening momentum despite further price gains.
In the event of a correction, key Fibonacci support levels lie at $7 and $4.50, which could act as potential reentry points for long positions.
Predominantly Bullish Signals on the 4H Chart
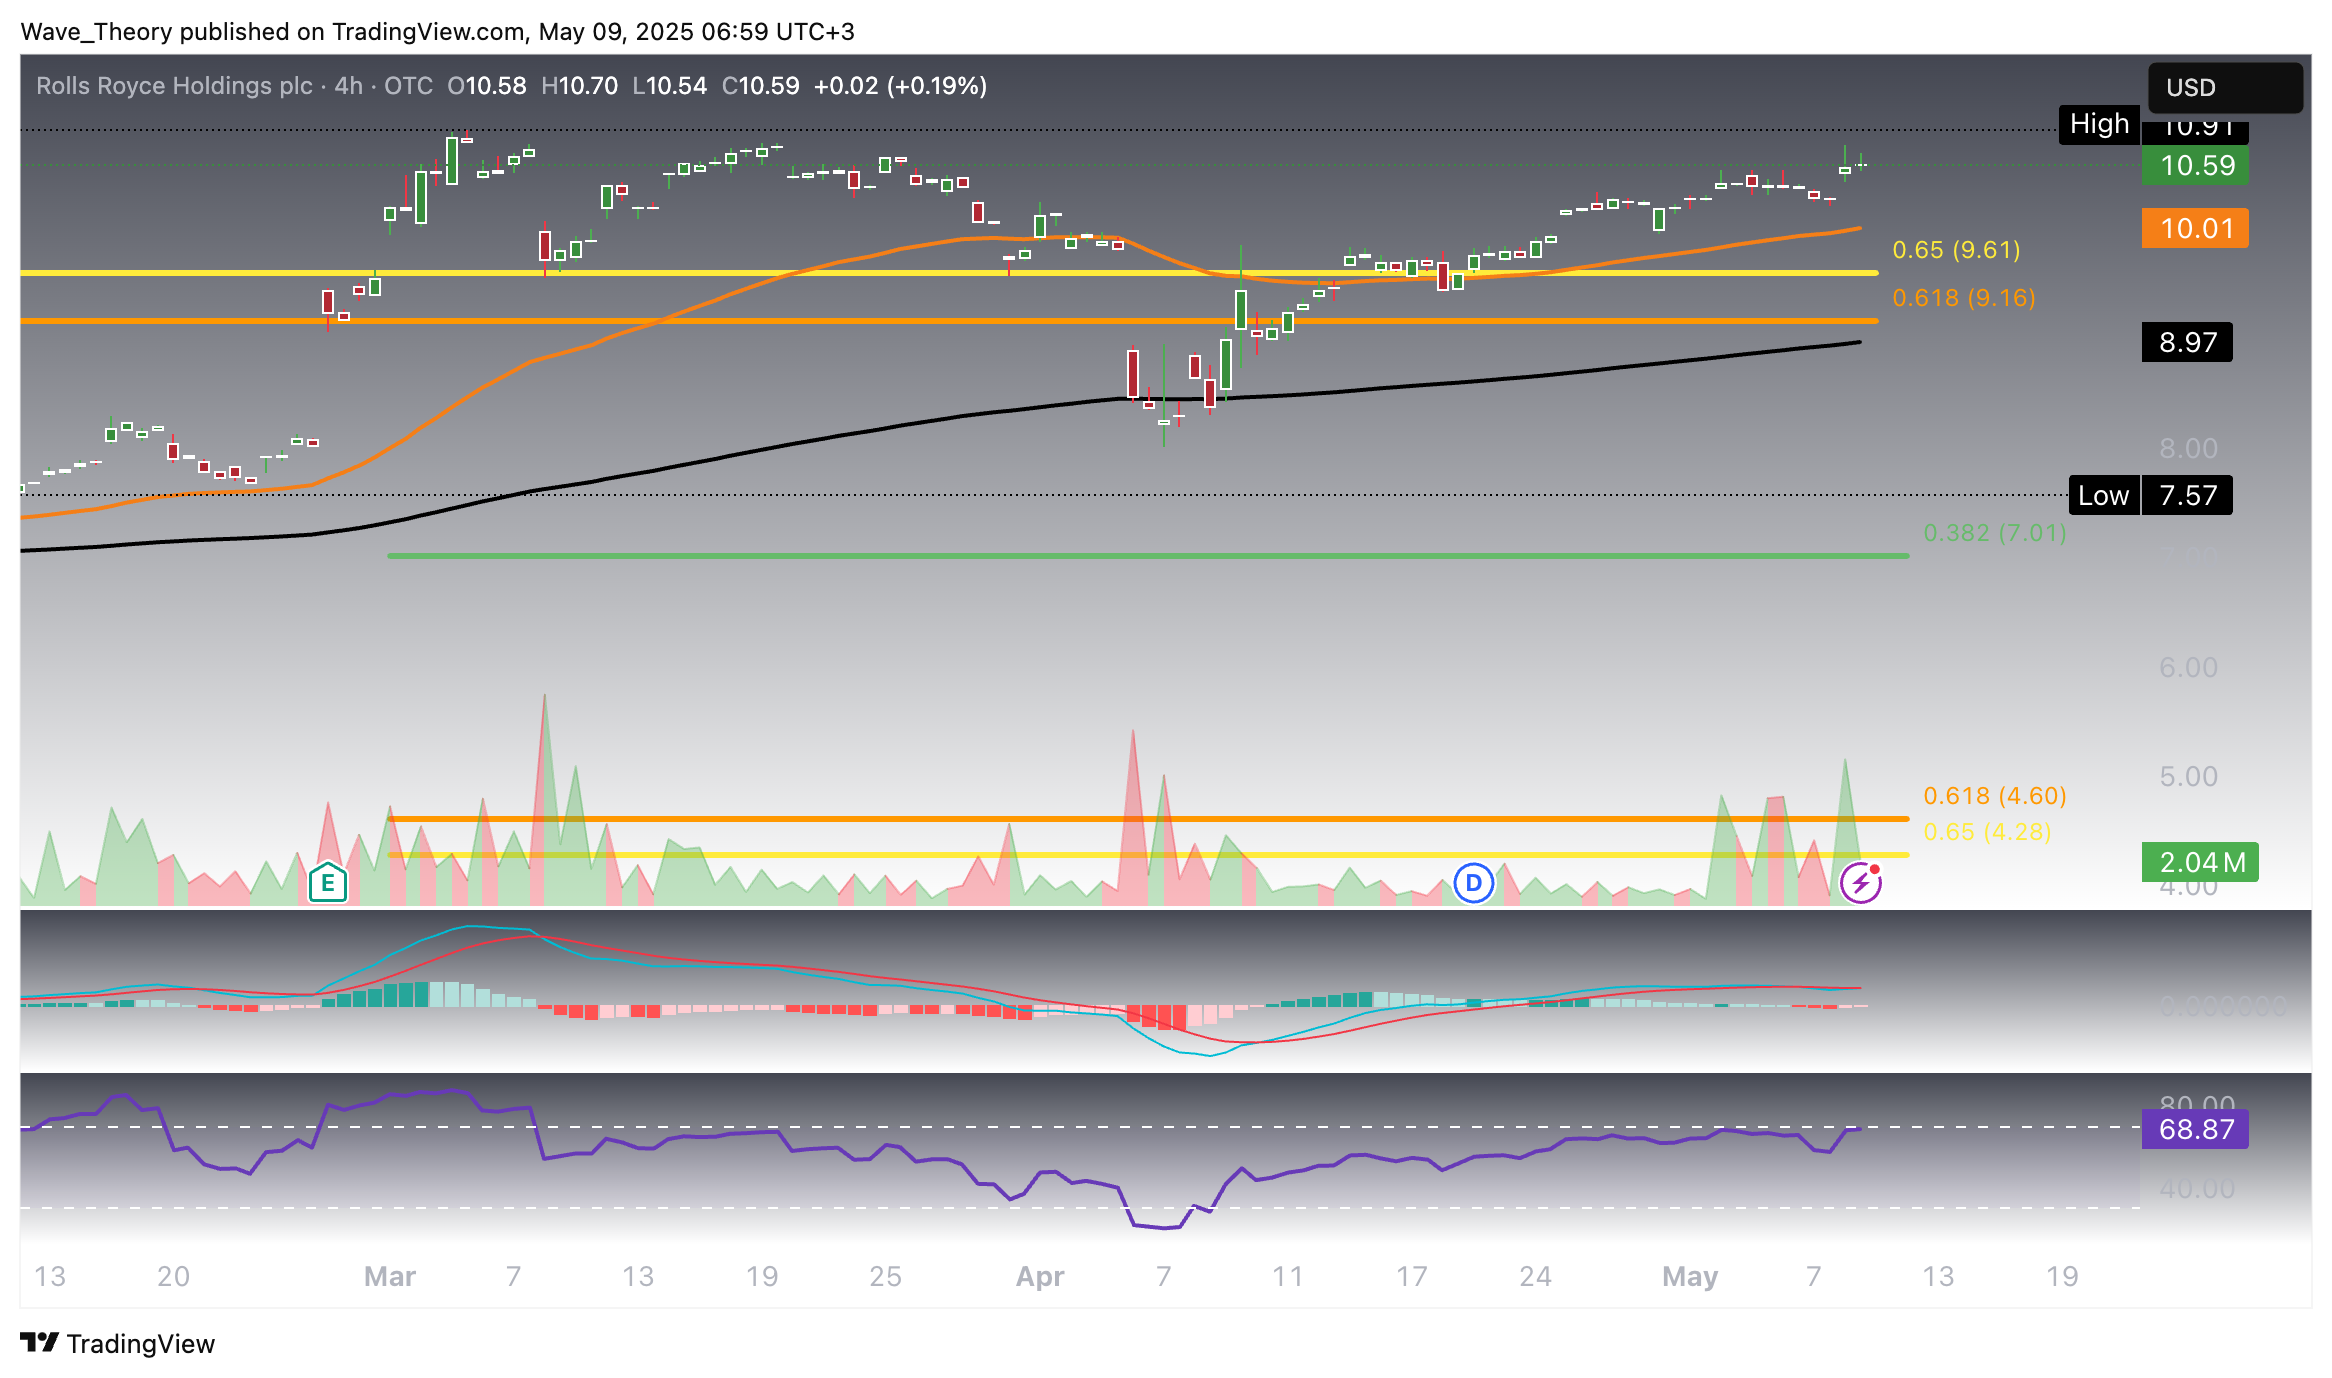
On the 4H chart, the indicators suggest a predominantly bullish outlook. The EMAs have executed a golden crossover, confirming a bullish trend in the short-term. The MACD histogram continues to tick higher, indicating strengthening momentum, although the MACD lines are still bearishly crossed at the moment.
Meanwhile, the RSI is approaching overbought levels but shows no immediate signs of bearish divergence, suggesting that the uptrend could persist in the short-term despite the heightened momentum.
In summary
Rolls-Royce stock has seen an impressive 1,434% surge over the past 2.5 years, breaking key Fibonacci levels and showing strong bullish momentum across multiple timeframes. On the weekly chart, the golden crossover of EMAs and bullish MACD lines signal mid-term strength, though a potential bearish divergence in the RSI could caution against further price gains. Similarly, the daily chart shows bullish signals, with the MACD histogram rising and EMAs confirming the trend, but a possible RSI divergence at higher prices may signal a correction. On the 4H chart, a golden crossover and bullish MACD histogram reinforce short-term strength, though the RSI is nearing overbought territory. If a correction occurs, support levels lie at $7 and $4.50, while upside potential points to the $14 level and potentially higher toward $21.30. Despite the bullish technicals, caution is advised due to the potential for bearish divergence in the RSI across multiple charts.
