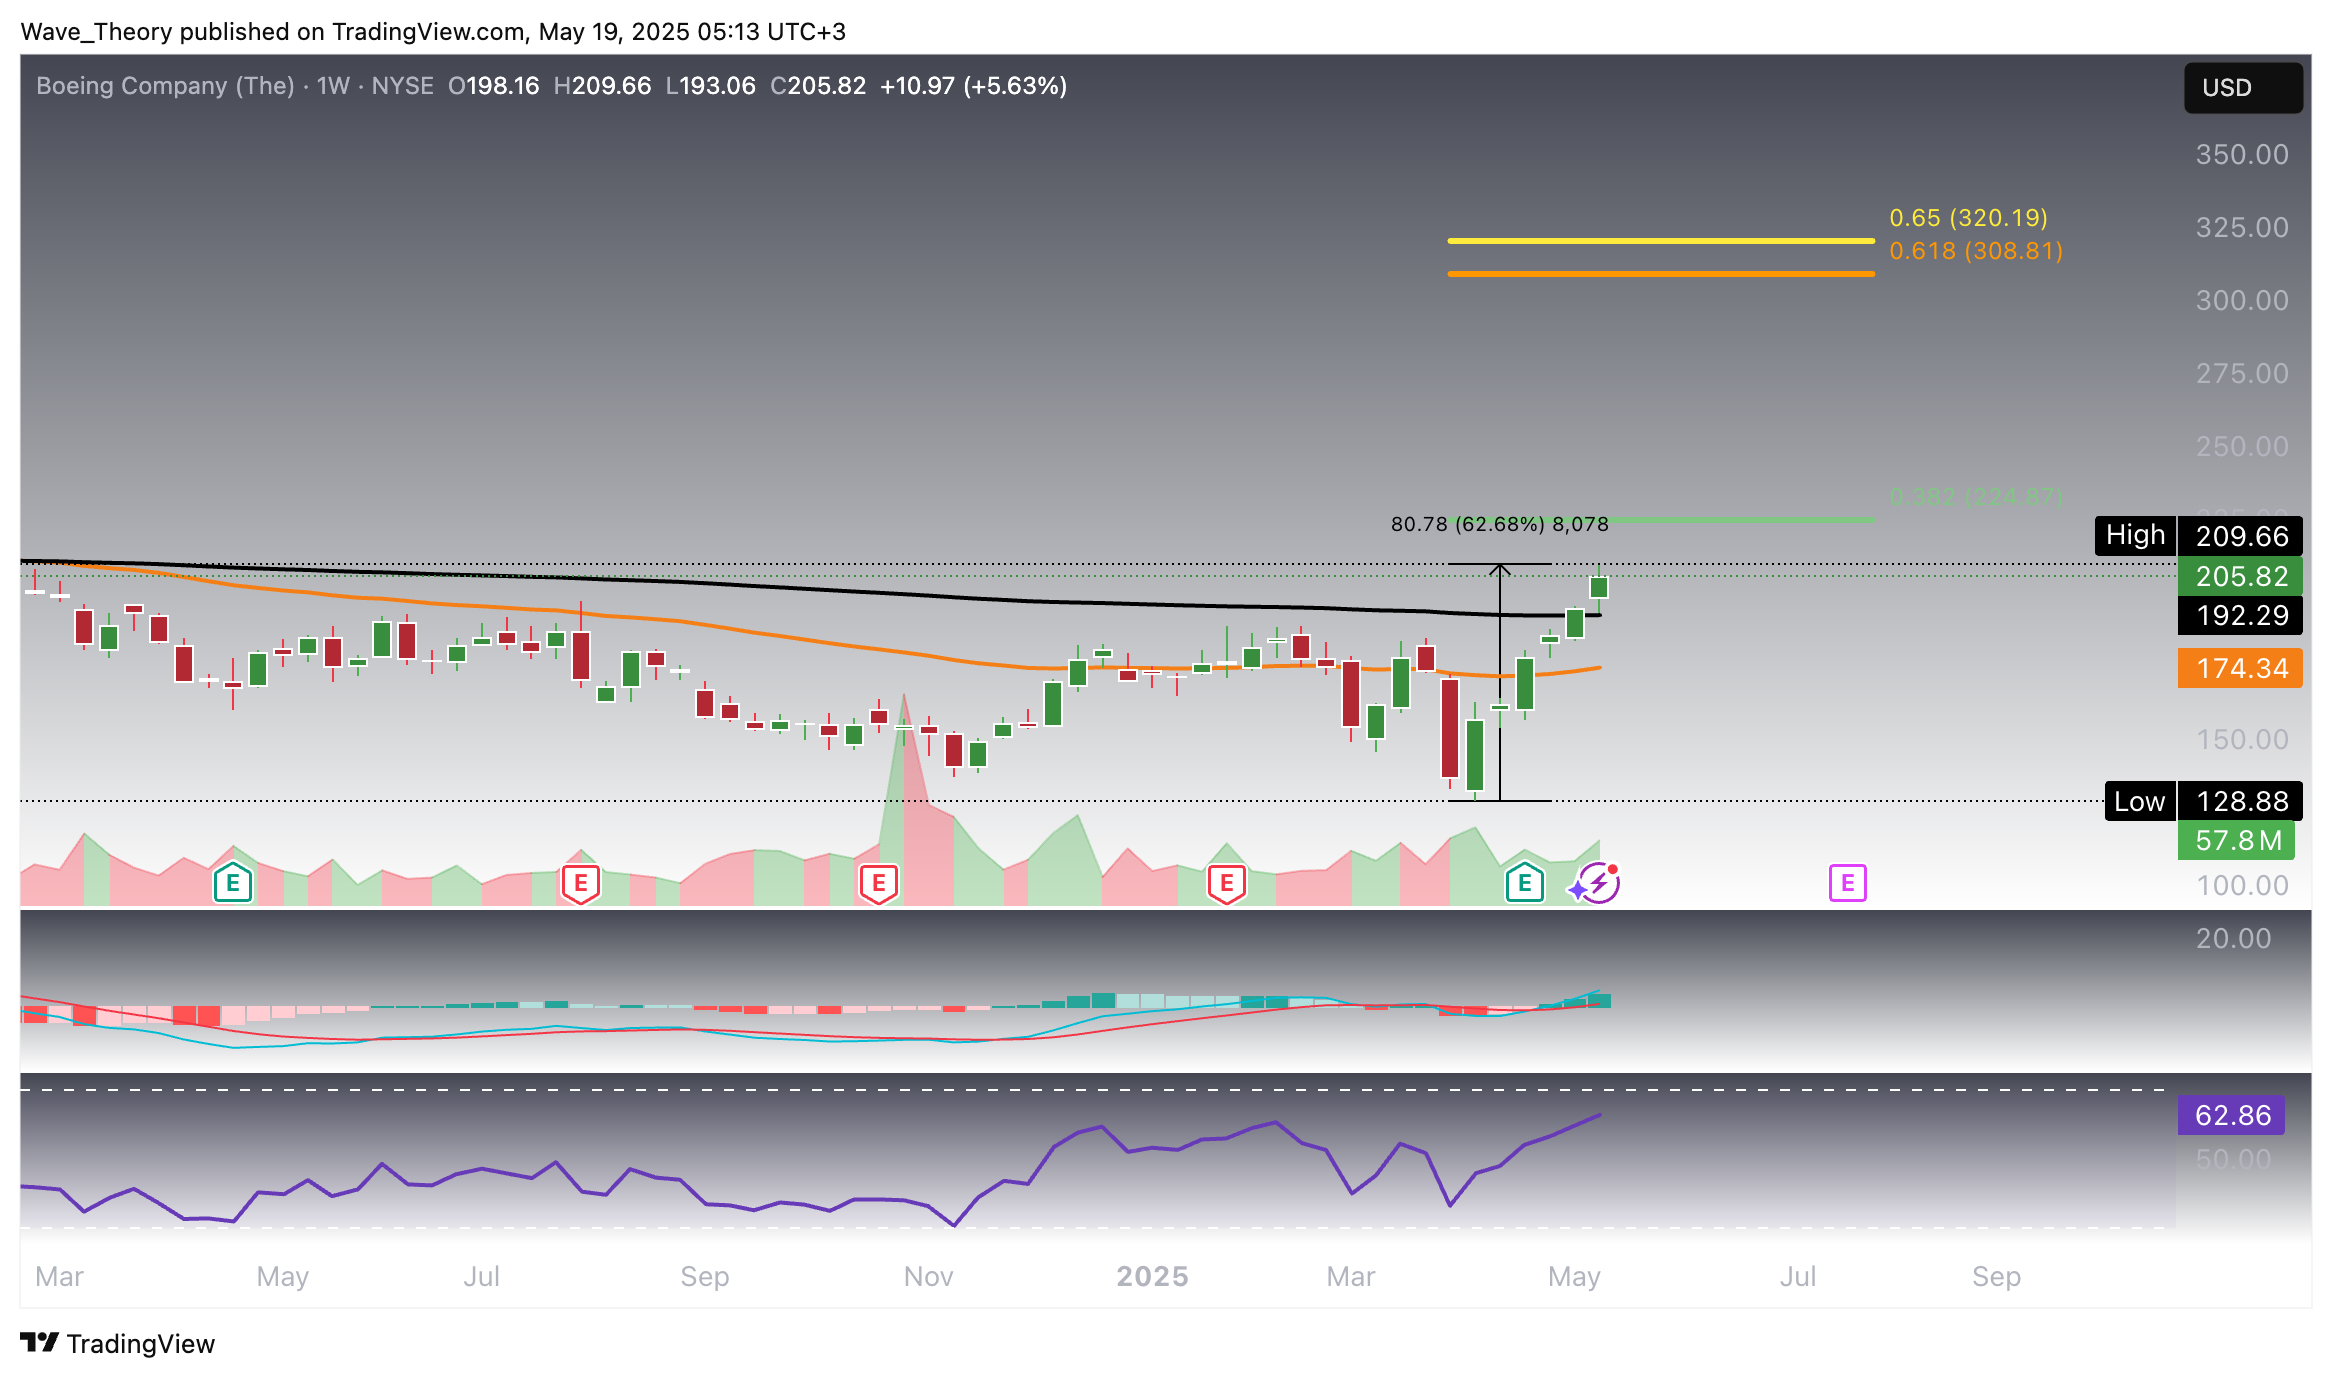
On the weekly chart, the technical indicators present a mixed outlook. The RSI remains in neutral territory, offering no immediate directional bias. The MACD, however, signals bullish momentum, with the MACD lines maintaining a bullish crossover and the histogram trending higher. Despite this upward momentum, the EMAs continue to exhibit a death cross, confirming that the mid-term trend remains bearish for now. A resolution of this divergence between momentum and trend structure will be critical in determining Boeing’s next directional move.
Boeing (BA) Stock Skyrockets 62% in Just Six Weeks – What’s Fueling the Rally?
•
Last updated: Wednesday, June 4, 2025

Quick overview
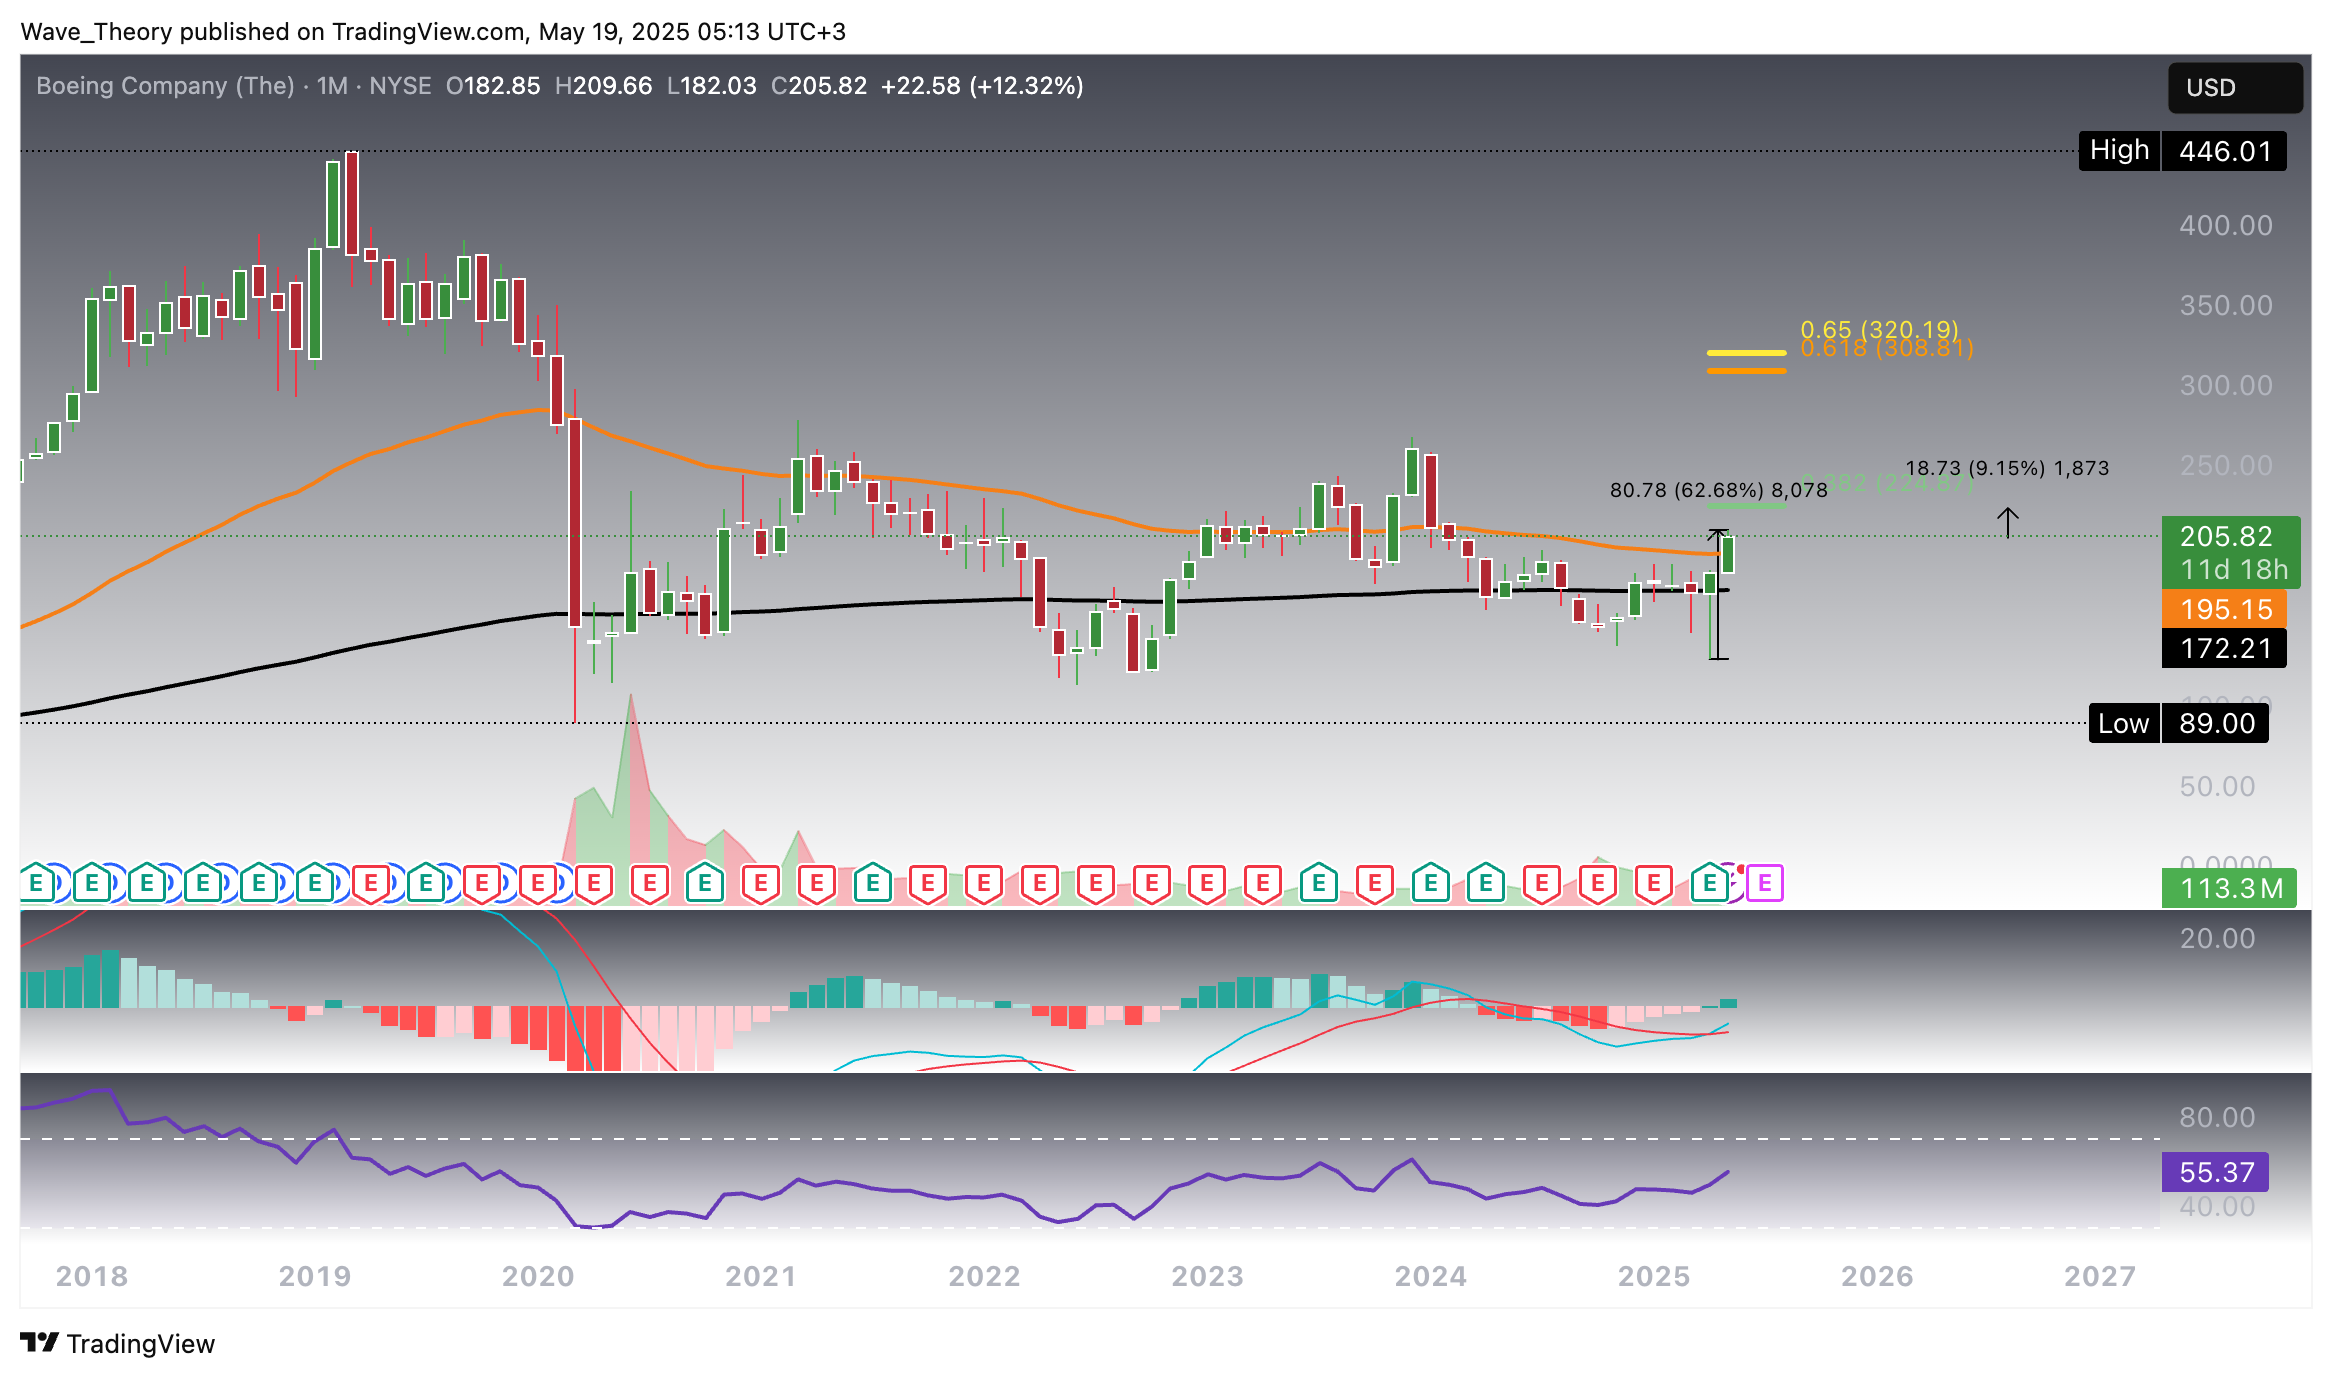
- Boeing (BA) stock has surged over 62% in six weeks, breaking above the 50-month EMA and nearing Fibonacci resistance at $225.
- A successful breakout above $225 could lead to a target of $320, while a rejection may result in a pullback to support levels at $179 and $158.
- Technical indicators show bullish momentum on longer timeframes, but short-term signals indicate potential consolidation or pullback.
- The mixed signals on various charts highlight the uncertainty in Boeing's next directional move.
Boeing (BA) stock has posted an exceptional gain of over 62% within the past six weeks, rebounding sharply from recent lows and reclaiming key structural levels. With momentum accelerating into potential resistance zones, the critical question now arises: is this the beginning of a sustained bullish breakout, or is a corrective retracement imminent as overbought signals start to surface?
Boeing (BA) Stock Surges Over 62% In Six Weeks: More Upside Ahead?
Following a remarkable 62% rally over the past six weeks, Boeing (BA) stock has decisively broken above the 50-month EMA at $195. A sustained monthly close above this key moving average would constitute a significant long-term bullish signal, potentially setting the stage for a continued move toward the 0.382 Fibonacci resistance at $225 — implying further upside of approximately 9.15%.
From a technical perspective, the indicators reinforce the bullish outlook. The exponential moving averages (EMAs) and MACD lines remain bullishly crossed, affirming the strength of the prevailing uptrend on the macro timeframe. Additionally, the MACD histogram is ticking higher, signaling increasing bullish momentum, while the RSI trends within neutral territory, offering room for further price appreciation before approaching overbought conditions.
Looking ahead, the next major structural resistance lies at $320. Only with a decisive breakout above the golden ratio at that level would Boeing fully re-enter a long-term uptrend. marking a true macro reversal in the broader picture.
Boeing (BA) Bullish Indicators On The Weekly Chart
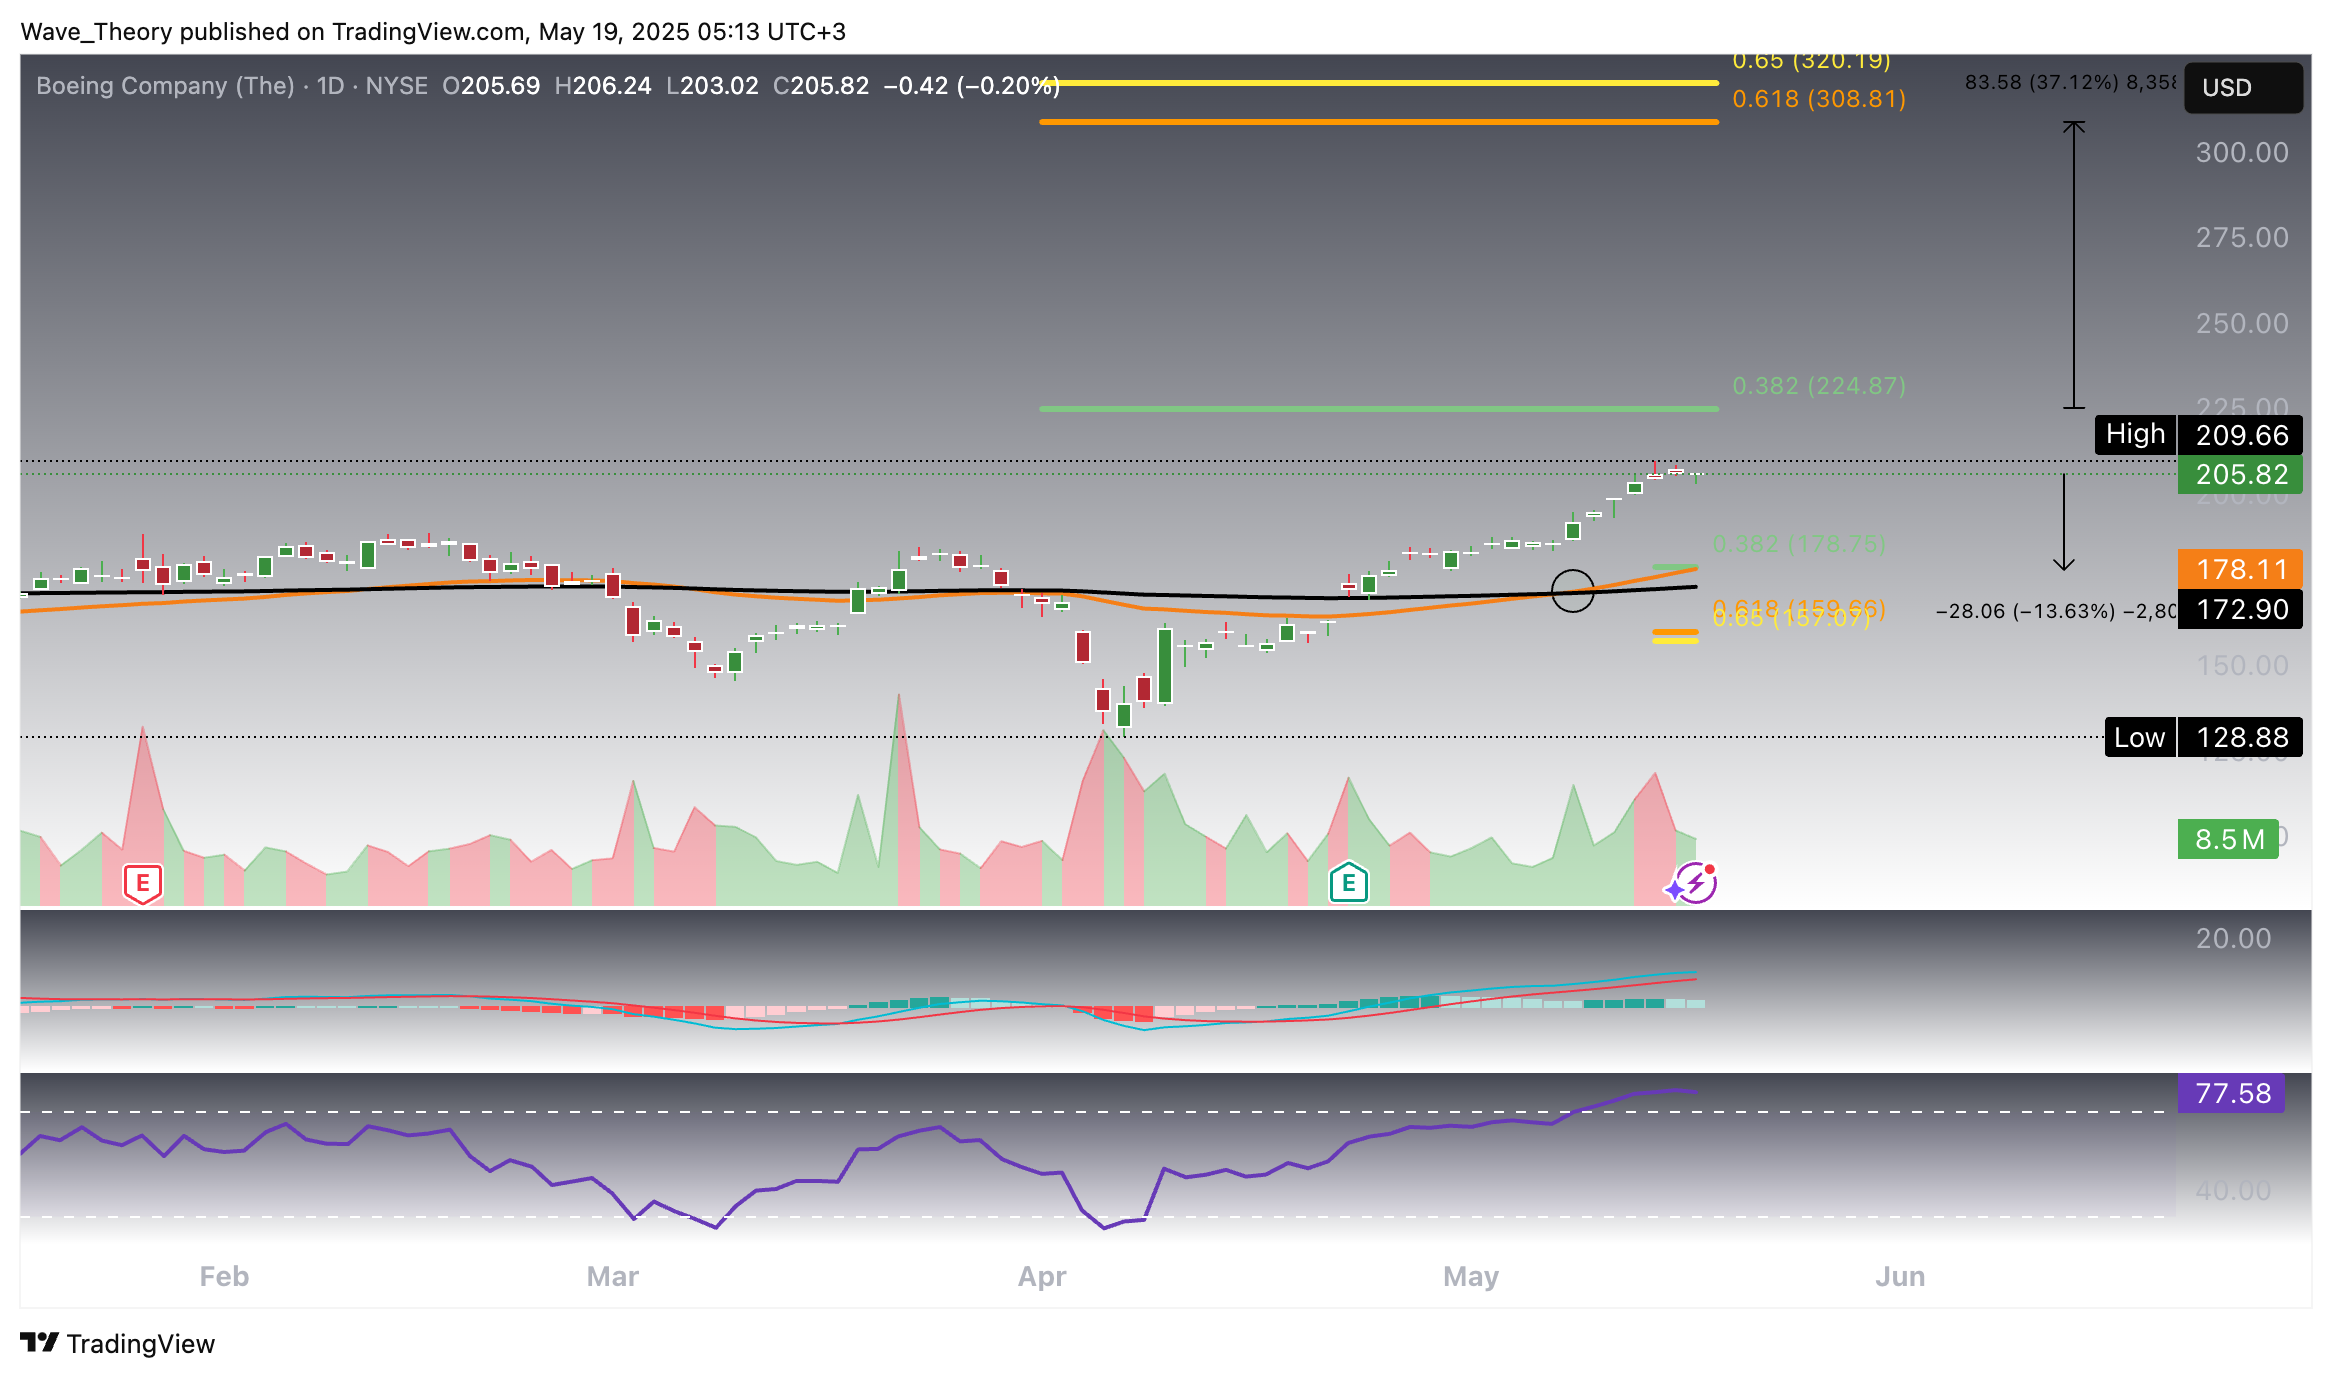
Golden Crossover On The Boeing (BA) Stock’s Daily Chart
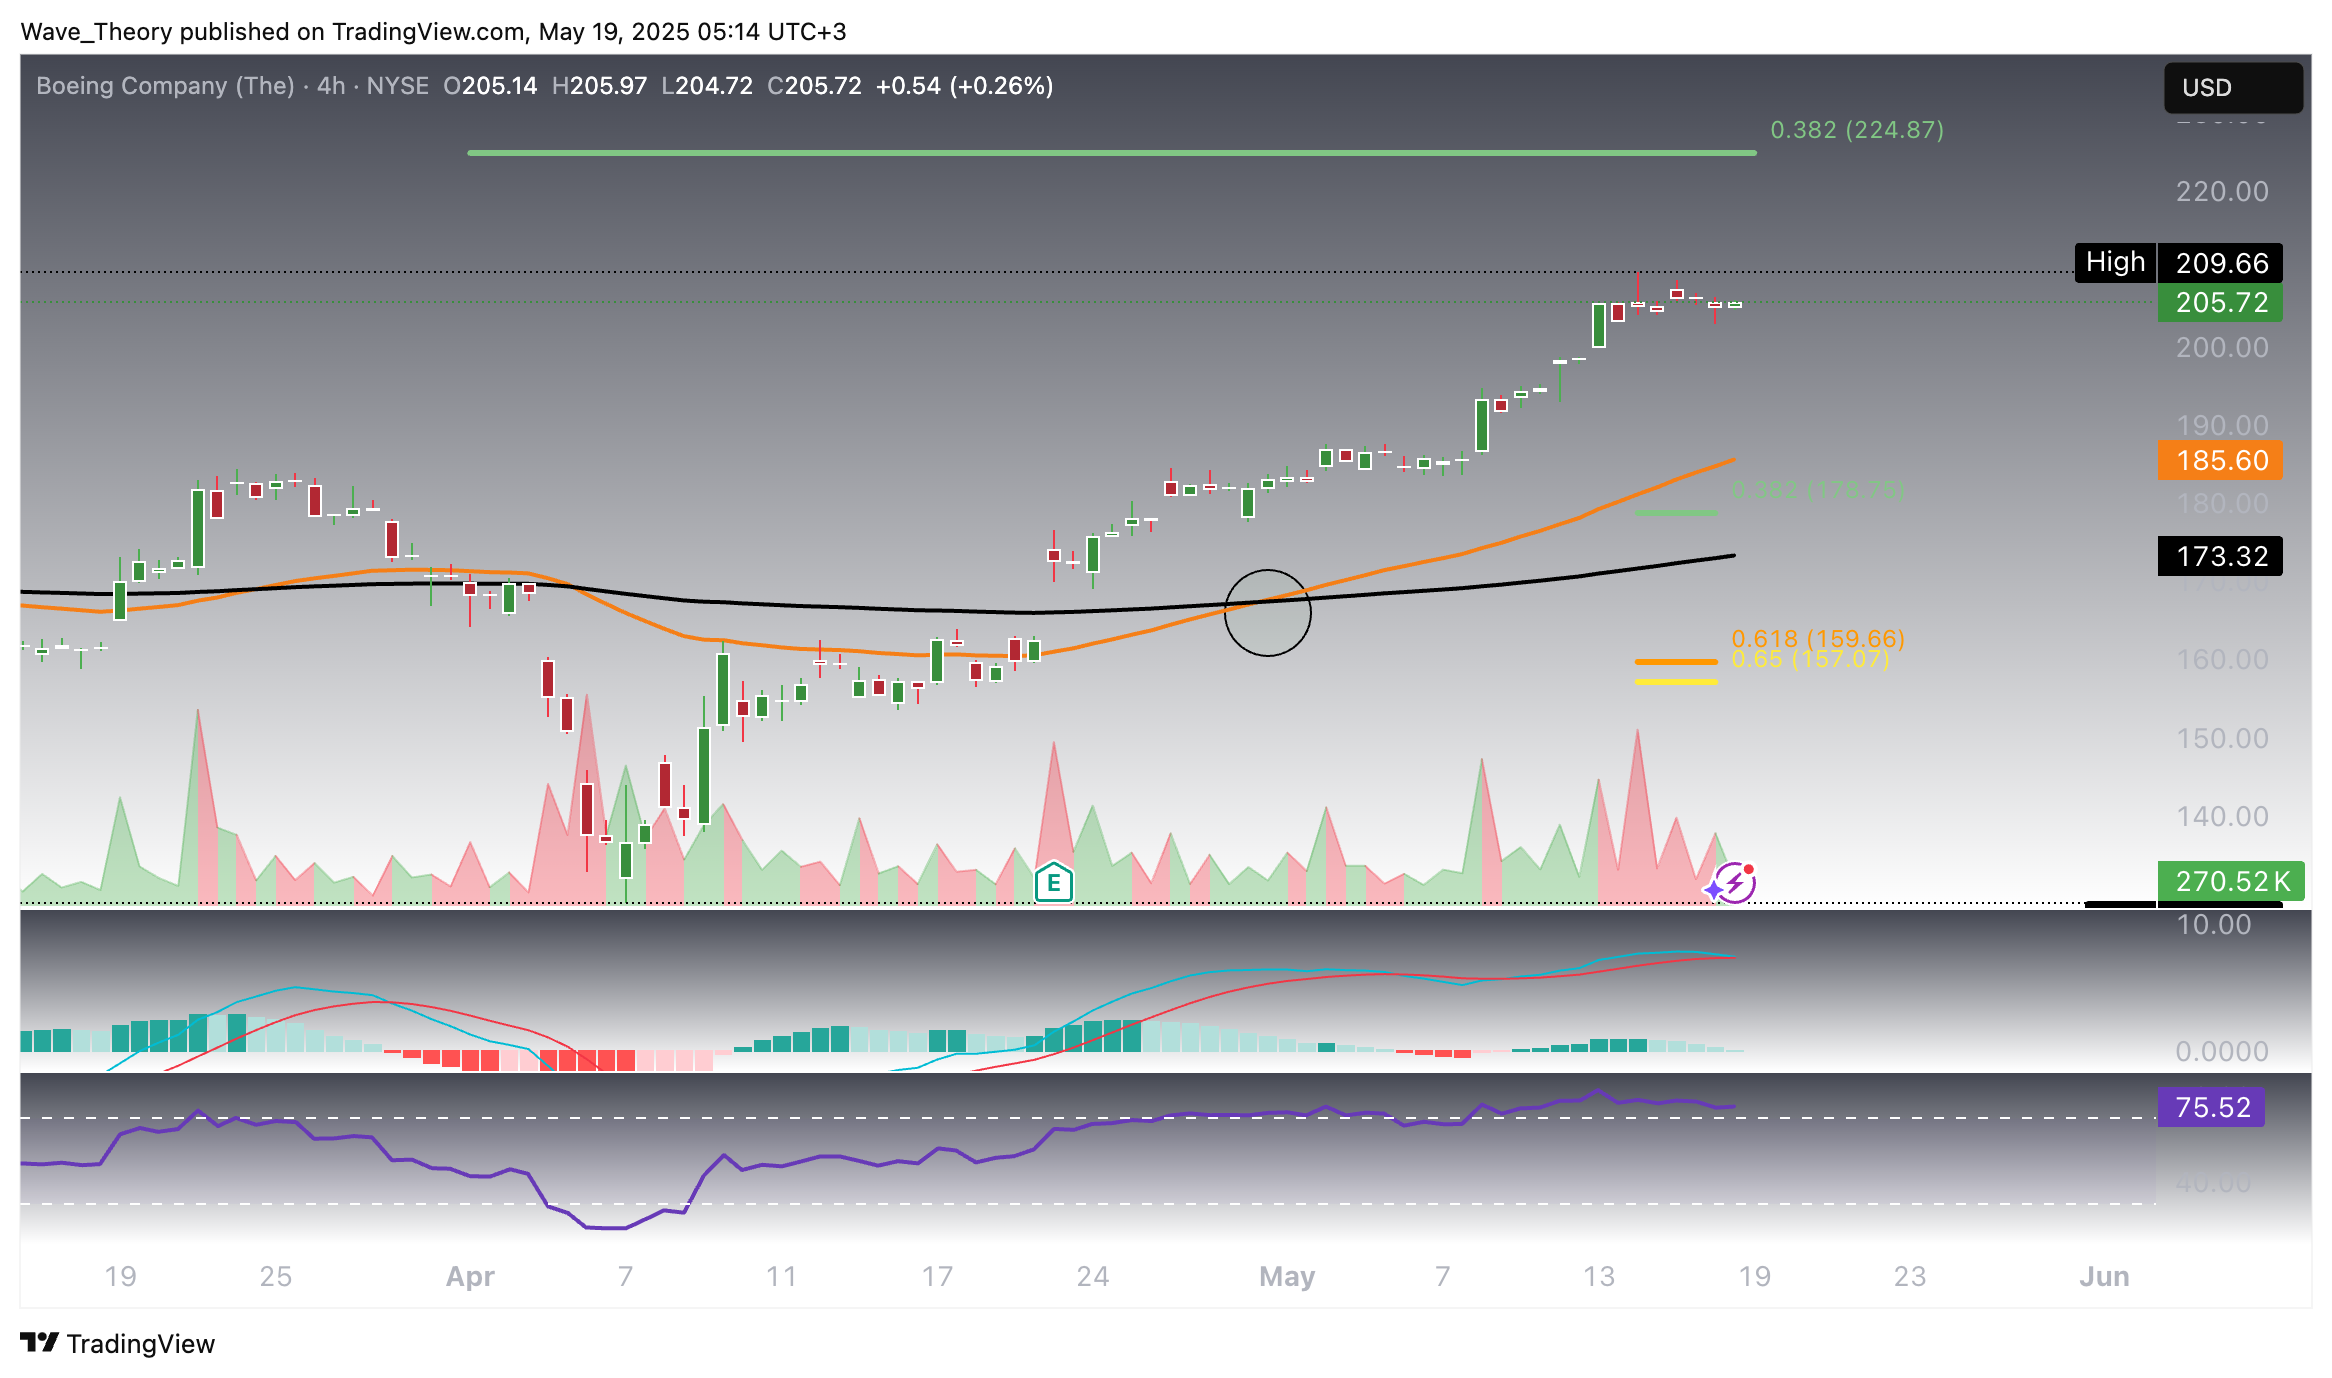
Mixed Signals On The 4H Chart
Boeing
Summary
- Check out our free forex signals
- Follow the top economic events on FX Leaders economic calendar
- Trade better, discover more Forex Trading Strategies
- Open a FREE Trading Account
- Read our latest reviews on: Avatrade, Exness, HFM and XM
ABOUT THE AUTHOR
See More
Konstantin Kaiser
Financial Writer and Market Analyst
Konstantin Kaiser comes from a data science background and has significant experience in quantitative trading. His interest in technology took a notable turn in 2013 when he discovered Bitcoin and was instantly intrigued by the potential of this disruptive technology.
Related Articles
Sidebar rates
Ava

