META stock initially plunged 35% but has since recovered to an all-time high of around $785.
Bearish divergences on the monthly and weekly charts indicate potential weakness, suggesting a possible short-term correction.
Key support levels to watch include the 0.382 Fibonacci retracement at $519 and the 50-day EMA at $703.
Despite mixed signals, the overall technical backdrop remains bullish, favoring upward momentum if key support levels hold.
At the start of the year, META stock plunged 35%, shaking investor confidence. Over the past four months, the tech giant has staged an impressive recovery, climbing to a new all‑time high of around $785. But with market signals turning mixed, could another sharp drop be just around the corner?
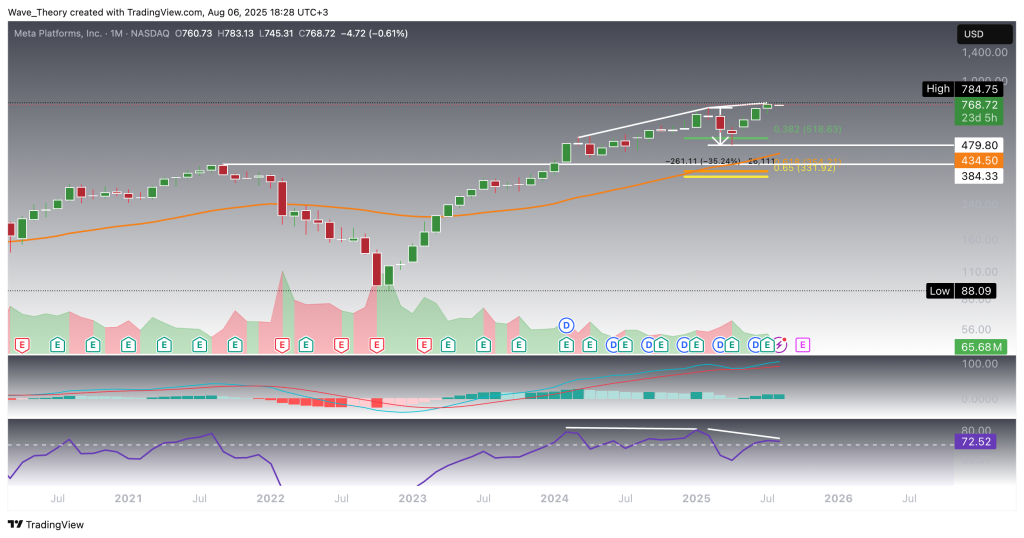
Bearish Divergences Reemerge on META’s Monthly Chart
META stock experienced a sharp decline of approximately 35%, finding critical support near the 0.382 Fibonacci retracement level at $519. From this key level, the price staged a robust recovery rally of nearly 64%, culminating in a fresh all-time high around $785. This initial correction was preceded by a pronounced bearish divergence on the RSI, signaling underlying weakness despite price strength.
Currently, the monthly RSI is once again exhibiting bearish divergence, suggesting that momentum is waning at these elevated price levels. This technical red flag warrants a heightened level of caution for investors and traders alike.
Should the stock succumb to renewed selling pressure, a retest of the 0.382 Fibonacci support near $519 appears probable. More conservative downside targets include the 50-month exponential moving average (EMA) around $434.5, which has historically served as dynamic support. Furthermore, a broad horizontal support zone exists between $384 and $480, adding to potential layers of defense. Should these levels fail, the golden ratio level at $332 could act as a critical longer-term support level.
On a more constructive note, the MACD indicator remains bullish, with the MACD line maintaining a positive crossover above the signal line. Additionally, the MACD histogram continues to reflect upward momentum, tempering the bearish implications signaled by the RSI divergences.
In summary, while momentum indicators present mixed signals, the presence of bearish RSI divergence on the monthly chart should prompt prudent risk management. Key Fibonacci and moving average support levels will be critical in defining META’s next directional move.
META
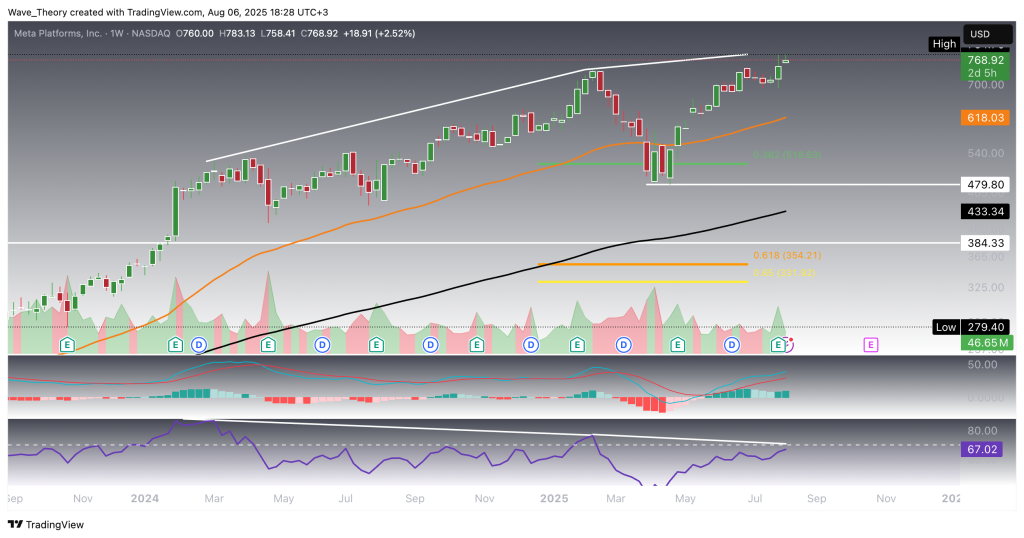
Mostly Bullish Signals On META’s Weekly Chart
On the weekly timeframe, the MACD lines remain firmly bullishly crossed, supported by the alignment of the EMAs, which collectively confirm the ongoing mid-term uptrend. The MACD histogram has continued its upward trajectory since last week, reinforcing positive momentum in the intermediate term.
However, caution is warranted as the weekly RSI is currently exhibiting a bearish divergence, signaling a potential corrective pullback despite the prevailing bullish trend. This divergence suggests that while momentum remains constructive, the stock may experience a short-term retracement before resuming its upward movement.
Should META initiate an immediate correction, the 50-week EMA at $618 stands out as the next key support level to monitor for potential price stabilization.
META
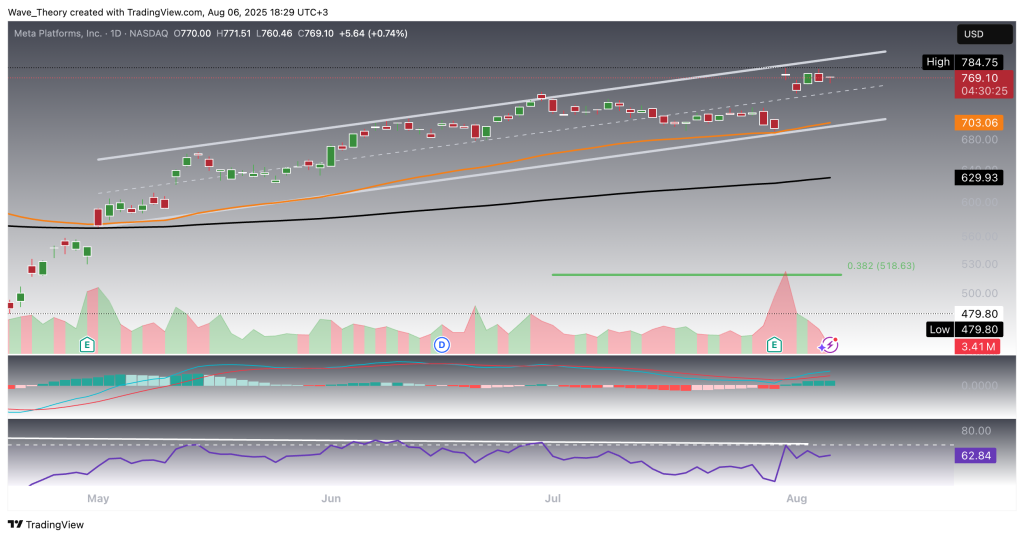
META Stock: Potential 10% Pullback Amid Otherwise Bullish Structure
META may be setting up for a short-term correction of approximately 10%. Following its recent pullback, the stock found interim support by rebounding off the 50-day EMA at $703. With current price action showing signs of hesitation, a retest of this level appears increasingly likely.
Should the 50-day EMA fail to hold as support, the next key downside level lies at the 200-day EMA, currently positioned around $630—representing a broader structural support within the longer-term trend.
Despite the potential for near-term weakness, the overall technical backdrop remains constructive. The MACD lines are firmly bullishly crossed, and the alignment of short- and mid-term EMAs continues to confirm upward momentum. Additionally, the RSI is residing in neutral territory, offering room for movement in either direction without immediate overbought or oversold pressure.
In sum, while a 10% correction cannot be ruled out, the prevailing trend structure and indicator alignment continue to favor the bulls over the intermediate horizon—provided key support levels are respected.
META
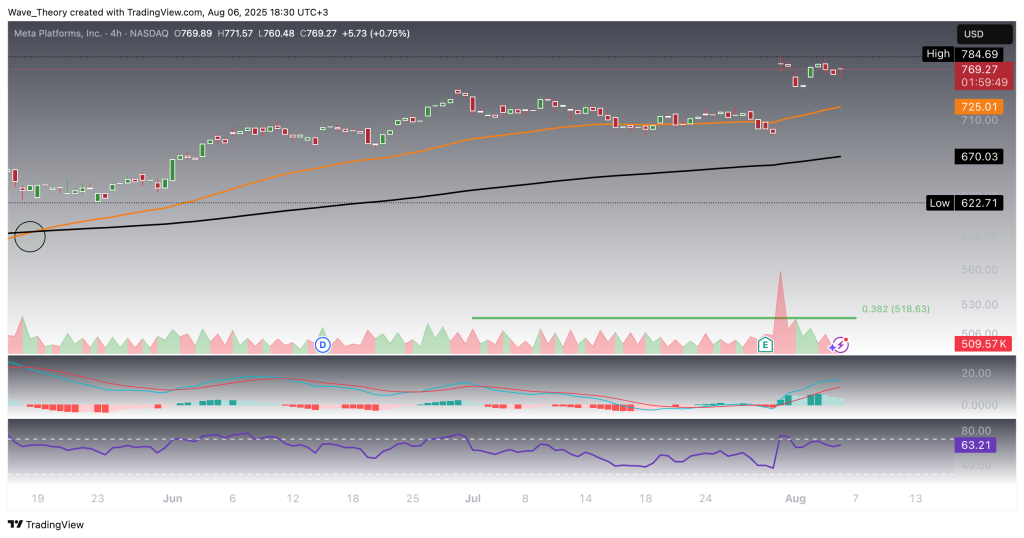
Mixed Signals Emerge on META’s 4H Chart
The 4-hour chart for META presents a blend of conflicting signals, suggesting caution in the near term. On the bullish side, a recent golden crossover of the EMAs confirms upward momentum in the short-term trend. Supporting this, the MACD lines remain bullishly crossed, while the RSI hovers in neutral territory—leaving room for directional movement without immediate exhaustion.
However, there are early signs of fading momentum. The MACD histogram is ticking lower, indicating a potential shift in underlying momentum, and price action is beginning to show signs of deceleration. These developments suggest that META may be vulnerable to a short-term pullback despite the current trend alignment.
Traders should monitor closely for confirmation of either continuation or reversal, as the current setup lacks clear directional conviction.
Konstantin Kaiser comes from a data science background and has significant experience in quantitative trading. His interest in technology took a notable turn in 2013 when he discovered Bitcoin and was instantly intrigued by the potential of this disruptive technology.