Lululemon (LULU) Stock Forecast 2025: Growth Potential or Overvalued Risk?

Quick overview
- Lululemon Athletica has transformed from a niche brand to a global leader in the premium athleisure market, with over 760 stores worldwide.
- The stock has appreciated by approximately 1,324% over the past decade but is currently facing resistance in the $384 – $516.40 range and has entered a corrective phase.
- LULU is testing critical support at the 200-month EMA around $160, which will be pivotal in determining its future price direction.
- Technical indicators show a bearish outlook on multiple timeframes, with key resistance levels at $213.5, $298, and $394 that need to be reclaimed for a potential recovery.
Lululemon Athletica (NASDAQ: LULU) has grown from a niche yoga apparel brand into a global leader in the premium athleisure market. With over 760 stores worldwide and a strong digital presence, the company continues to expand its footprint in North America, China, and other international markets.
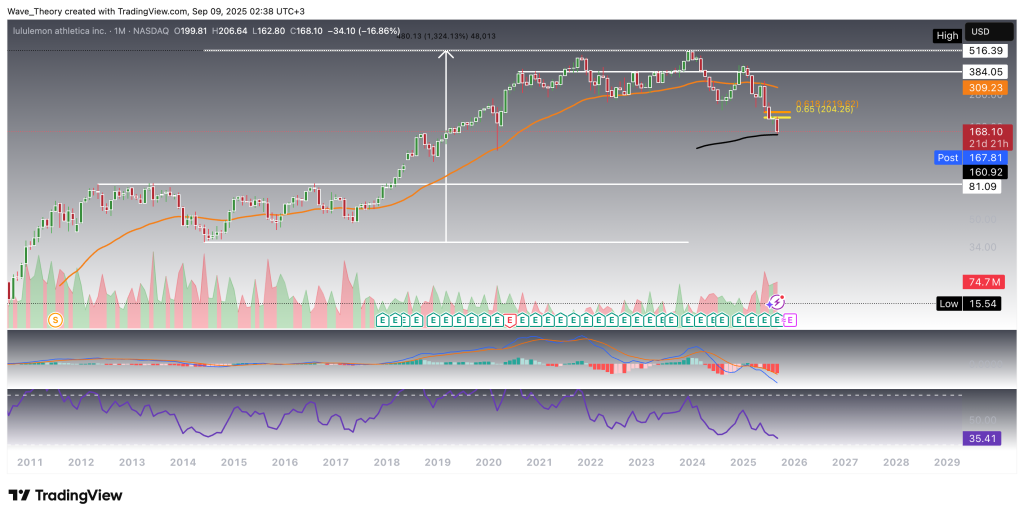
LULU Stock Reaches Critical Support at the 200-Month EMA
Over the past decade, Lululemon Athletica (LULU) has delivered a remarkable performance, appreciating by approximately 1,324%. This impressive long-term uptrend, however, has encountered significant resistance in the $384 – $516.40 range, where the stock entered a corrective phase.
During this pullback, LULU decisively broke below the golden ratio support at $204, extending the retracement toward the 200-month Exponential Moving Average (EMA) near $160. This level now serves as a critical support zone, where a potential bullish reaction could emerge.
From a technical perspective, the monthly indicators present a mixed outlook:
-
The Exponential Moving Averages (EMAs) continue to support the broader uptrend, with a golden crossover reinforcing bullish sentiment in the long term.
-
In contrast, the MACD lines have crossed bearishly, while the MACD histogram signals ongoing downside momentum.
-
Meanwhile, the Relative Strength Index (RSI) is drifting lower within neutral territory, leaving room for further downside before conditions become oversold.
In summary, while long-term momentum remains intact, the stock is now testing a pivotal inflection point at the 200-month EMA ($160). Price action at this level will be crucial in determining whether LULU can resume its primary uptrend or face deeper corrective pressure.
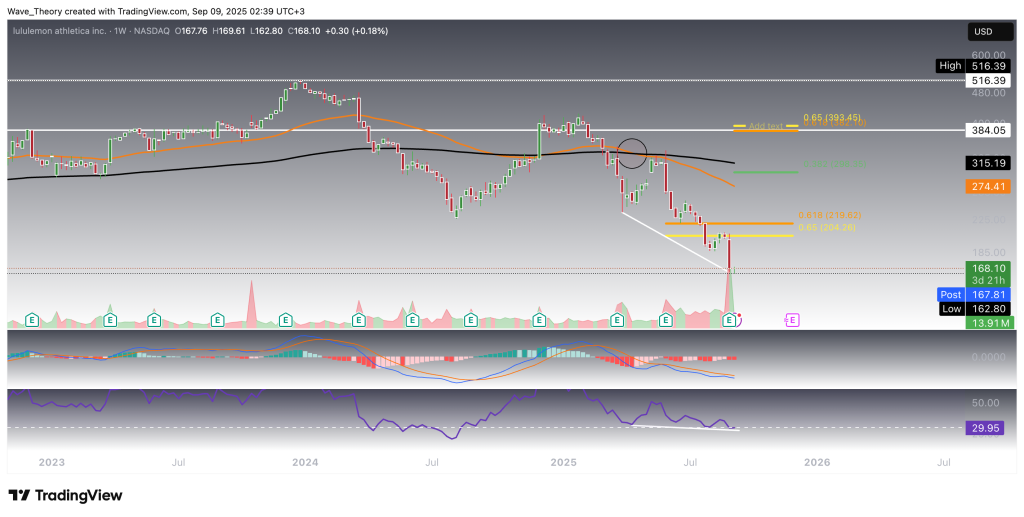
More Bearish Signals On The Weekly Chart
On the weekly timeframe, LULU presents a decisively bearish technical structure. The exponential moving averages (EMAs) have aligned into a death cross, signaling a mid-term downtrend confirmation. In parallel, the MACD lines remain bearishly crossed, with the histogram continuing its downward trajectory since last week—further reinforcing momentum to the downside. Meanwhile, the RSI flirts with oversold territory, underscoring weakening buying pressure.
That said, if LULU initiates a short-term relief bounce, the next significant Fibonacci resistance levels come into play at $298 and $394. Importantly, only a sustained break above the golden ratio at $394 would invalidate the ongoing correction phase, opening the door for a potential recovery trend.
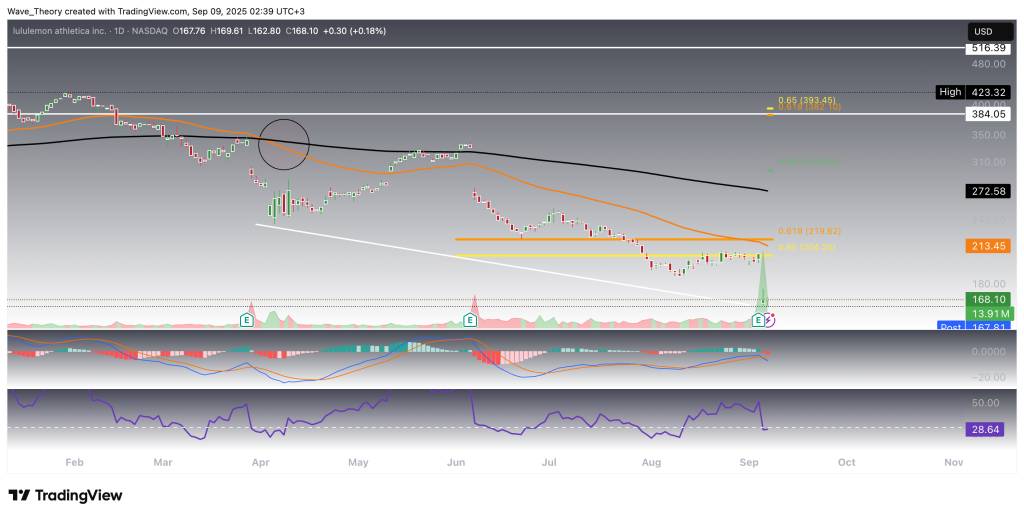
Daily Chart Confirms the Bearish Bias
The daily chart mirrors the bearish structure observed on the weekly chart. The exponential moving averages (EMAs) are aligned in a death cross, reinforcing the short- to medium-term downtrend. Momentum indicators add weight to this outlook: the MACD lines remain bearishly crossed, the MACD histogram continues to tick lower, and the RSI trends sideways within slightly oversold territory, showing a lack of bullish conviction.
If LULU attempts a short-term recovery, it faces immediate overhead resistance at the 50-day EMA, currently positioned at $213.5. Until this level is decisively reclaimed, downside risks remain dominant.
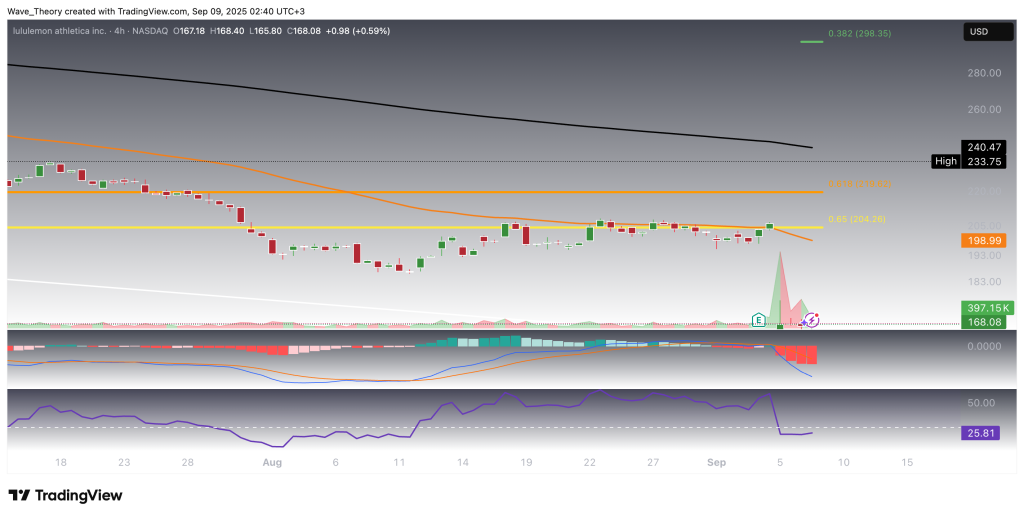
4H Chart Extends the Bearish Structure
The 4-hour timeframe reinforces the prevailing bearish bias. The EMAs are locked in a death cross, confirming downside momentum in the short term. Complementing this, the MACD lines remain bearishly crossed, the MACD histogram continues to trend lower, and the RSI drifts within neutral territory, underscoring a lack of bullish divergence.
This alignment suggests that near-term rallies are likely to face strong resistance and may ultimately resolve into continued weakness unless key levels are reclaimed.
LULU Technical Summary
LULU has delivered a 1,324% gain over the past decade but entered a corrective phase between $384 – $516.4. Price broke below the Fib 0.618 ($204) and retraced to the 200-month EMA at $160, where it now finds critical long-term support.
-
Monthly chart: Mixed signals. Golden crossover of EMAs supports mid-term bullish trend, but MACD and RSI lean bearish/neutral.
-
Weekly chart: Bearish alignment with EMA death cross, MACD bearish, RSI near oversold. Key resistances: $298 and $394 (Fib). Break above $394 is required to invalidate the correction.
-
Daily chart: Death cross active. First major resistance at the 50-day EMA ($213.5).
-
4H chart: Fully bearish structure with EMA death cross, MACD weakness, RSI neutral.
Key Support: $160 (200M EMA)
Key Resistances: $213.5 (50D EMA), $298, $394 (golden ratio / invalidation level)
- Check out our free forex signals
- Follow the top economic events on FX Leaders economic calendar
- Trade better, discover more Forex Trading Strategies
- Open a FREE Trading Account
- Read our latest reviews on: Avatrade, Exness, HFM and XM
Related Articles

Sidebar rates
Related Posts
