Apple (AAPL) Stock Tanks Amid New Iphone Release

Quick overview
- Apple stock (AAPL) faced significant selling pressure after the iPhone 17 launch but is now showing signs of recovery.
- The stock rebounded sharply from a 35% correction, breaking through the golden ratio resistance at $227, which has now become a support level.
- Technical indicators present a mixed outlook, with bullish trends in EMAs and MACD, but caution is advised due to bearish divergence in the RSI.
- The potential for AAPL to retest its all-time high at $260 remains, contingent on sustaining bullish momentum.
Apple stock (AAPL) came under heavy selling pressure this week following the launch of the new iPhone 17. Despite the initial drop, the stock is now showing signs of a sharp rebound, raising the question of whether buyers are stepping back in at key support levels.
Apple Stock (AAPL) Rebounds Sharply, Correction Phase Invalidated
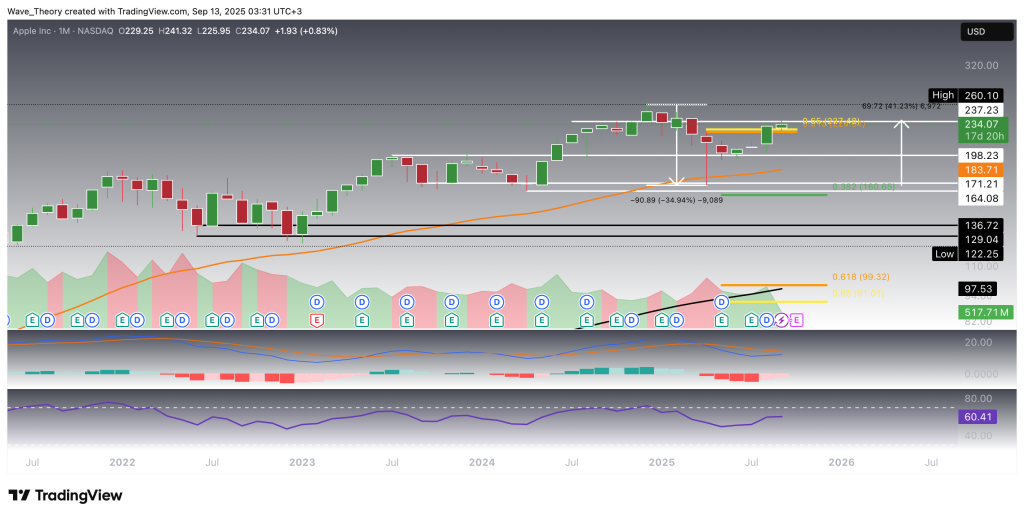
From late last year into the early months of this year, Apple stock (AAPL) underwent a significant correction, declining by approximately 35% before finding strong support in the $164–$171 zone. This support level provided the base for a powerful recovery, with the stock rallying roughly 43% in the months that followed.
Crucially, during this advance, AAPL decisively broke through the golden ratio resistance at $227. This breakout effectively invalidates the prior correction phase and opens the door for a potential retest of the all-time high at $260, with scope for new record highs if bullish momentum persists.
From a technical standpoint, the monthly chart reinforces the bullish bias. The EMAs have established a golden crossover, confirming a long-term uptrend. Furthermore, the MACD histogram has been trending higher since last month, signaling strengthening momentum. However, this is tempered by the fact that the MACD lines remain in a bearish crossover and the RSI continues to hover in neutral territory, suggesting room for further upside but also warranting cautious optimism.
Apple Stock (AAPL) Now Finds Support at Former Golden Ratio Resistance
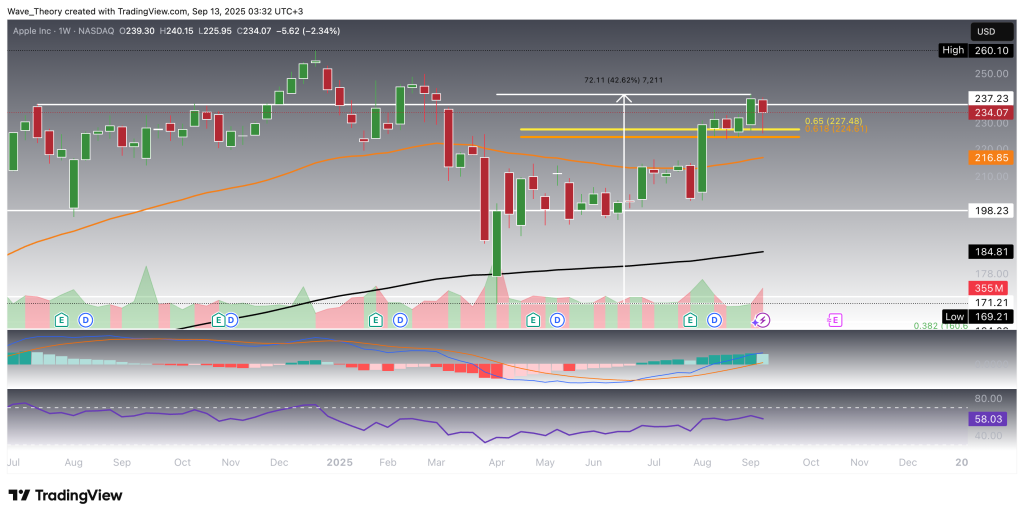
The golden ratio level at $227, which had previously served as a major resistance, has now flipped into a support zone, where Apple stock (AAPL) appears to be attempting a bullish rebound. Earlier this week, AAPL declined by nearly 6%, but the price action now indicates a potential recovery from this critical level.
From a technical perspective, the outlook remains mixed. On the bullish side, the MACD lines remain in a bullish crossover, and the EMAs continue to display a golden crossover, confirming the trend bullishly in the mid-term. However, caution is warranted as the MACD histogram has begun to tick lower this week, reflecting bearish momentum building amid the recent pullback. Meanwhile, the RSI holds steady in neutral regions, leaving room for directional confirmation in the coming sessions.
Daily Chart – Mixed Signals With Diverging Momentum
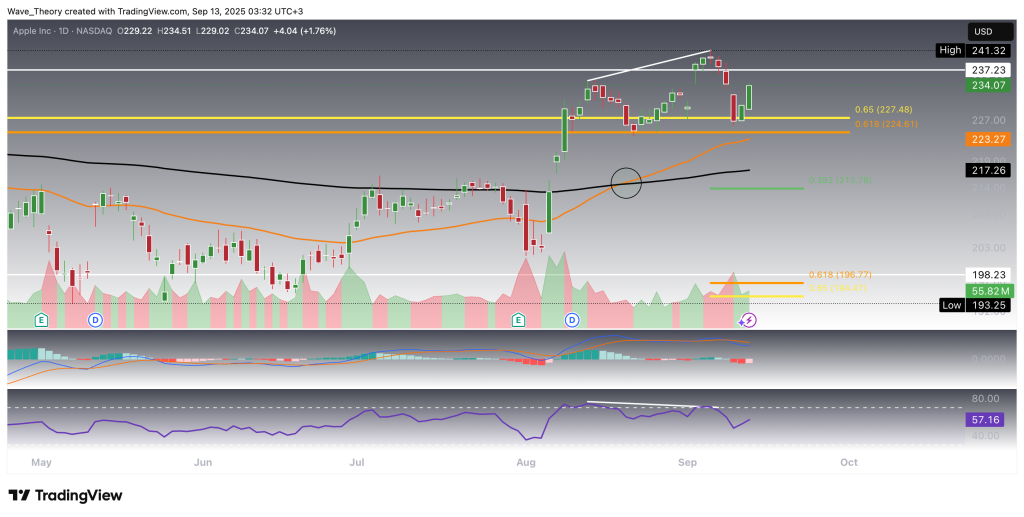
On the daily chart, Apple (AAPL) presents a set of mixed technical signals. The EMAs have established a golden crossover, confirming the trend bullishly in the short- to medium term. However, the RSI displays a bearish divergence, which has already translated into a steep decline earlier this week, signaling potential downside pressure.
At the same time, the MACD lines remain bearishly crossed, reinforcing the short-term bearish bias. Yet, in contrast, the MACD histogram has started to tick bullishly higher this week, suggesting that momentum may be shifting and a recovery attempt could be underway.
4H Chart – Conflicting Signals With Bearish Divergence
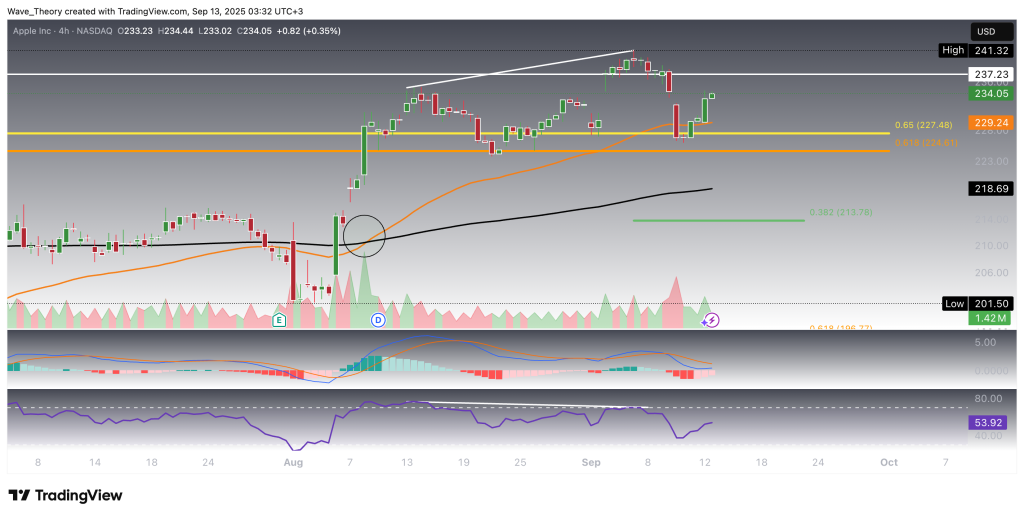
The 4H chart presents a similar mixed outlook. The RSI shows a bearish divergence, hinting at potential downside risk. Meanwhile, the EMAs have formed a golden crossover, confirming the trend bullishly in the short-term. At the same time, the MACD lines remain bearishly crossed, yet the MACD histogram has begun to tick higher, suggesting that bearish momentum may be weakening and a rebound attempt could be forming.
Apple (AAPL) – Technical Summary
Apple stock recently rebounded strongly after a 35% correction into the $164–$171 support zone, surging 43% and breaking the golden ratio resistance at $227. This invalidated the broader correction phase and opens upside potential toward the all-time high at $260 and possibly new record levels.
Currently, $227 now acts as key support, reinforced by a golden EMA crossover on multiple timeframes. The weekly and daily charts show mixed signals: the RSI displays bearish divergence and the MACD lines remain bearishly crossed, while the MACD histogram has begun to turn higher.
- Check out our free forex signals
- Follow the top economic events on FX Leaders economic calendar
- Trade better, discover more Forex Trading Strategies
- Open a FREE Trading Account
- Read our latest reviews on: Avatrade, Exness, HFM and XM
Related Articles


Sidebar rates
Related Posts
