Whale Buys $16M in PEPE, 16% Jump: Can Symmetrical Triangle Fuel $0.000014 Breakout?
Pepe (PEPE) up 16% in 24 hours to $0.000012 after a whale bought 1.52 trillion tokens worth $16 million from Kraken...
Quick overview
- Pepe (PEPE) surged 16% in 24 hours to $0.000012 following a whale purchase of 1.52 trillion tokens worth $16 million.
- The rally is supported by the ongoing altcoin season, with smaller tokens outperforming Bitcoin and attracting retail traders.
- Key factors driving the momentum include strong community sentiment, a token burning mechanism, and bullish technical indicators.
- A close above $0.0000126 could signal further price increases, targeting levels up to $0.0000163.
Pepe (PEPE) up 16% in 24 hours to $0.000012 after a whale bought 1.52 trillion tokens worth $16 million from Kraken. This is one of the largest purchases in Pepe’s history and has sparked momentum in the memecoin space.
Whale activity is a powerful catalyst. When tokens are removed from exchanges it reduces selling pressure and shows long term conviction. Retail traders follow these moves because large investors may have insight into future price action.
Altcoin Season Boosts Meme Coins
Pepe’s rally is also riding the altcoin season wave where smaller tokens outperform Bitcoin. The Altcoin Season Index has just broken above 70, showing capital rotation from big coins into high risk high reward plays like PEPE.
Frogged faced memcoin Pepe Coin $PEPE is surging! 🐸
Driven by major whale buys, including one worth over $16M, $PEPE's price is up 16% today. Its trading volume has exploded by 189%, and it's outperforming other meme coins.
Could $PEPE be the leader of this altcoin season?… pic.twitter.com/HgmJEGiRxs
— CryptoniteUae (@CryptoniteUae) September 13, 2025
Community driven sentiment and a token burning mechanism that gradually reduces supply has amplified the effect. These features continue to make Pepe one of the most watched meme coins in the market today.
Key drivers behind the rally:
- Whale bought 1.52 trillion tokens worth $16 million
- Altcoin season rotation into smaller cap coins
- Strong social sentiment and community support
- Supply reduction through token burning
Pepe (PEPE) Technical Outlook: Symmetry Signals a Move
From a technical standpoint Pepe has formed a symmetrical triangle on the daily chart, a pattern that often precedes big moves. Price is testing the 50 day EMA at $0.0000107 and the 200 day EMA at $0.0000123.
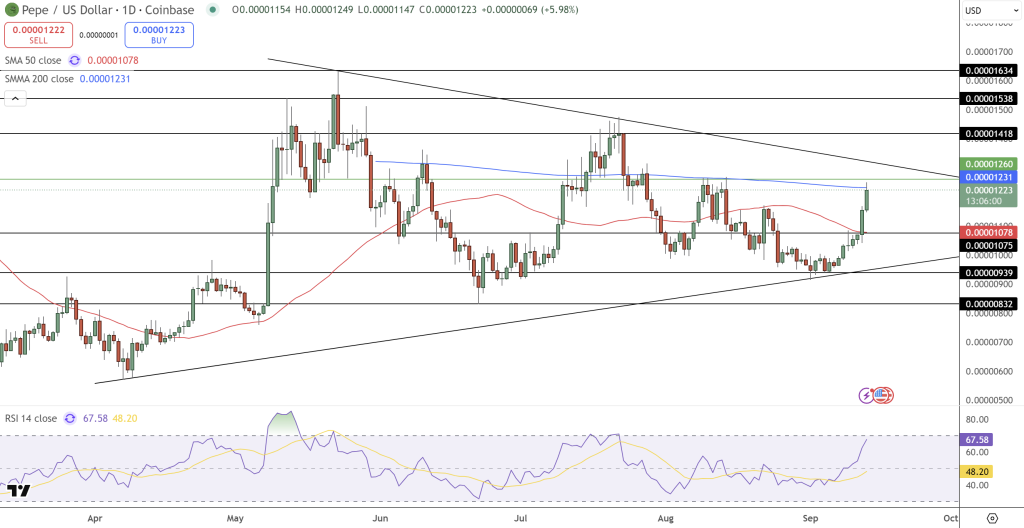
A close above $0.0000126 would confirm the break, potentially targeting $0.0000141, $0.0000153 and $0.0000163 if momentum continues. Support is at $0.0000100 and $0.0000093 where the trendline and previous swing lows converge.
The candlestick structure is also bullish. A series of long green candles is a three white soldiers pattern, a classic reversal. The RSI is at 67, showing strong momentum with room to run before overbought.Long above $0.0000126, stop $0.0000107. For noobs, just means PEPE is at the ceiling and if it breaks through, it will go fast.
- Check out our free forex signals
- Follow the top economic events on FX Leaders economic calendar
- Trade better, discover more Forex Trading Strategies
- Open a FREE Trading Account
- Read our latest reviews on: Avatrade, Exness, HFM and XM
Related Articles

Sidebar rates
Related Posts
