USD/CAD Forecast: 1.3728 Bounce Eyes 1.3863–1.3891 After Fed, BoC Cuts
USD/CAD is heading towards 1.3790 in the European session after rebounding sharply from 1.3728, a level that has held this month.
Quick overview
- USD/CAD is rising towards 1.3790 after a rebound from 1.3728, supported by a recent Fed rate cut.
- The Bank of Canada also cut its benchmark rate, contributing to the strength of the US dollar against the loonie.
- Technical analysis shows USD/CAD forming a descending triangle, with potential bullish reversal signals emerging.
- Key levels to watch include support at 1.3728 and resistance at 1.3826, with a break above indicating further upside potential.
USD/CAD is heading towards 1.3790 in the European session after rebounding sharply from 1.3728, a level that has held this month. The backdrop is supportive for the US dollar as the Fed delivered its first rate cut of the year, lowering the federal funds rate to 4.00-4.25%. Chair Jerome Powell called it a “risk management cut” citing softer labor market conditions while being data dependent.
Meanwhile the Bank of Canada cut its benchmark rate by 25 basis points to 2.50%, the lowest in three years, citing easing inflation pressures and a slowing labor market. The policy divergence – Fed cautious, BoC more accommodative – has added to the greenback’s strength against the loonie and keeps USD/CAD up.
Key levels to watch
- Support: 1.3728, 1.3691
- Resistance: 1.3826, 1.3863, 1.3891
- Extension if broken: 1.3940
USD/CAD Technical Picture: Triangle in Focus
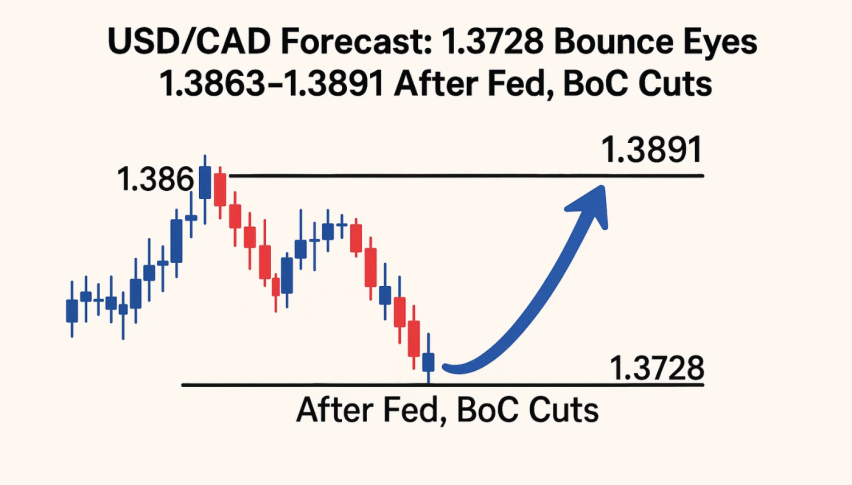
The 4 hour chart shows USD/CAD inside a descending triangle, lower highs and a flat base at 1.3728. The rebound was confirmed by a series of strong green candles, similar to the early stages of a 3 white soldiers pattern, often a precursor to a bullish reversal.
Momentum is improving. RSI is above 50, rejection wicks at the lows indicate fading seller strength and shorter timeframes are flirting with an EMA crossover. If buyers hold above 1.3780-1.3800, upside looks possible.

A break above 1.3826 would put 1.3863 in play, a confirmed bullish engulfing candle above 1.3891 would confirm the breakout to 1.3940. Below 1.3728 risks a retest of 1.3691, a break there would invalidate the rebound.For beginners, 1.3728 is the “line in the sand”. Above it’s good for buyers, below it’s back to the bears. A clear plan is to buy on confirmation: wait for a close above 1.3826 to target 1.3863 and 1.3891, stop below 1.3785. If price breaks and closes above 1.3891 the path is open to 1.3940.
Or if a shooting star or bearish engulfing candle appears at resistance it might be a short setup to 1.3780 and 1.3728. Macro factors are the wild card – US labor data, Canadian growth reports and oil prices can shift momentum quickly. As long as 1.3728 holds momentum is up and traders are waiting for resistance to be confirmed.
- Check out our free forex signals
- Follow the top economic events on FX Leaders economic calendar
- Trade better, discover more Forex Trading Strategies
- Open a FREE Trading Account
- Read our latest reviews on: Avatrade, Exness, HFM and XM
Related Articles


Sidebar rates
Related Posts
