Oil Price Forecast: Iraq Pipeline Deal Pushes WTI to $61.93, Eyes $60.70
Oil falls 4% to $61.93 as Iraq pipeline deal restarts supply. Charts warn of deeper losses toward $60.70 unless buyers reclaim $63.35 resist
Quick overview
Oil prices fell for a fifth day on Tuesday as Iraq and the Kurdish region agreed to restart crude exports via Turkey and doubts about demand persisted. WTI and Brent have dropped 4% this week and traders are getting nervous about oversupply.
Iraq’s federal and Kurdish governments struck a deal to resume crude exports via Turkey, which will add around 230,000 b/d that had been shut since March 2023. LSEG analyst Anh Pham said, “The theme is still oversupply, demand outlook is uncertain as we head into year-end.”
Kurdish pipeline exports add to a market already awash in supply. The IEA latest report said global oil supply will rise faster this year and surplus risks will grow into 2026 as OPEC+ output increases and non-OPEC producers add capacity.
IEA Warnings and Shifting Global Trade
Oil’s problems go beyond Iraq. Saudi July exports hit a four-month low, according to JODI data, but Iraqi output is above OPEC+ targets. The EU is considering tighter sanctions on Russian oil, which could disrupt trade flows and add volatility.
US inventory is mixed. A Reuters poll said crude stockpiles likely rose last week, while gasoline and distillate supplies fell. This is a market caught between supply gluts and patchy demand.
Longer term, structural changes are also weighing on sentiment. Electric vehicles are rising fast and global trade tariffs are eroding expectations for strong oil demand growth in the years to come.
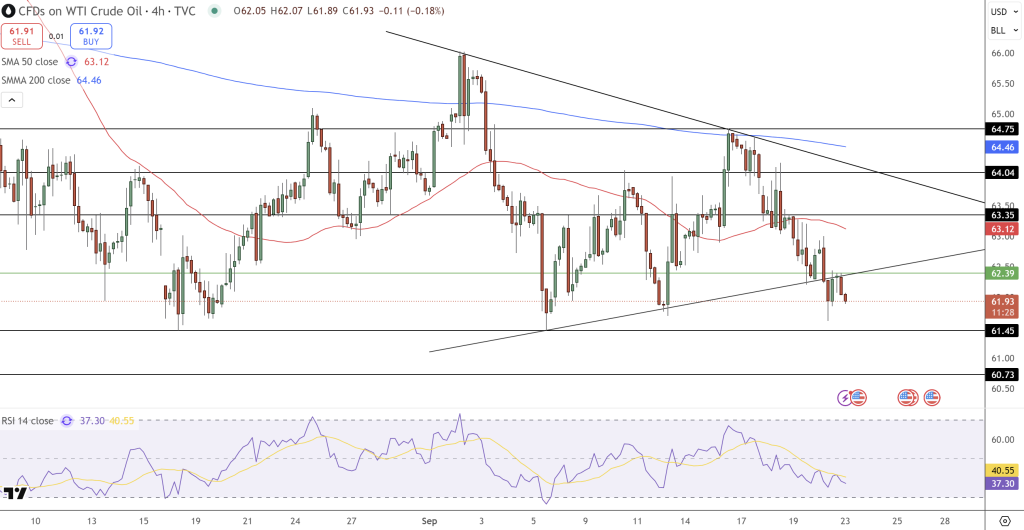
USOIL Technical Analysis: $61.90 Under Pressure
WTI fell to $61.93, below the 50-day SMA ($63.12) and 200-day SMA ($64.46). The 4-hour chart shows a descending triangle, with lower highs pressing on support near $61.45. Such patterns usually mean bearish continuation.
Candlestick action shows repeated failures at $62.30-$62.50, with sellers in control. The RSI is 37, close to oversold but no bullish divergence, so downside risk remains.
-
Support: $61.45, then $60.73 and $59.80
-
Resistance: $63.35 (50-SMA) and $64.75
-
Trade: Shorts below $61.90 with stop above $62.50 target $61.45, then $60.70
For bulls, need a close above $63.35 to change the trend to $66. Until then, lower is the path of least resistance.
In summary: Oil is oversupplied and demand uncertain, technicals are bearish. Traders are in a risk down market.
- Check out our free forex signals
- Follow the top economic events on FX Leaders economic calendar
- Trade better, discover more Forex Trading Strategies
- Open a FREE Trading Account
- Read our latest reviews on: Avatrade, Exness, HFM and XM
Related Articles

Sidebar rates
Related Posts
