Intel Corporation (INTC) Stock Nearly Doubles in Value Amid Strong Market Momentum
Quick overview
- Intel Corporation (INTC) stock has surged nearly 83.5% over the past six months, testing critical Fibonacci resistance at $30.4.
- A breakout above this resistance could lead to targets at $39 and potentially the $60-$76 resistance zone.
- Despite the bullish momentum indicated by MACD and golden cross formations, structural risks remain due to long-term bearish signals from monthly EMAs.
- Key support levels are identified at $26.8 and $23, which may provide a cushion in case of a market correction.
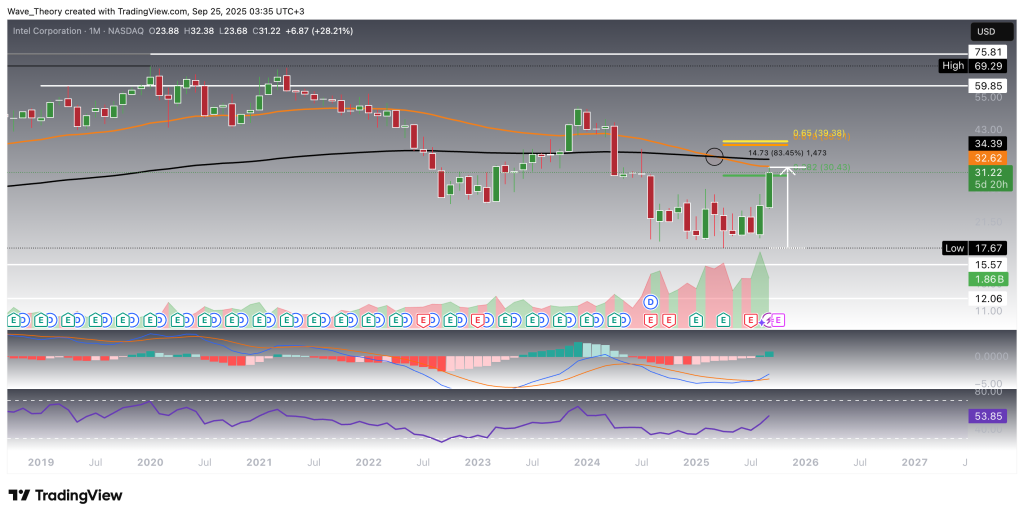
Intel Corporation (INTC) stock has nearly doubled over the past six months, rallying into a critical Fibonacci resistance zone. The key question now is whether Intel can extend this momentum and challenge its previous highs.
Intel Stock Reaches Critical Fib Resistance
Since the onset of the Covid pandemic in 2020, Intel Corporation (INTC) has been locked in a pronounced downtrend, sliding from a peak of $69 to as low as $17.7. Despite this decline, the stock has managed to leave the long-term support zone between $12 and $15.6 untouched. Recently, however, Intel has staged an impressive rebound, surging nearly 83.5% to test the critical 0.382 Fibonacci resistance at $30.4. A decisive bullish breakout above this level could open the path toward the golden ratio resistance at $39.
Should the stock manage to clear the $39 threshold, the next upside targets lie in the broader resistance band between $60 and $76, marking a potential continuation of its recovery trajectory. That being said, structural risks remain: the monthly EMAs have formed a death cross, underscoring a persistent long-term bearish bias. On the other hand, momentum indicators are flashing strength — the MACD lines have crossed bullishly, with the MACD histogram trending sharply higher. Meanwhile, the RSI remains neutral, offering no clear directional signal at this stage.
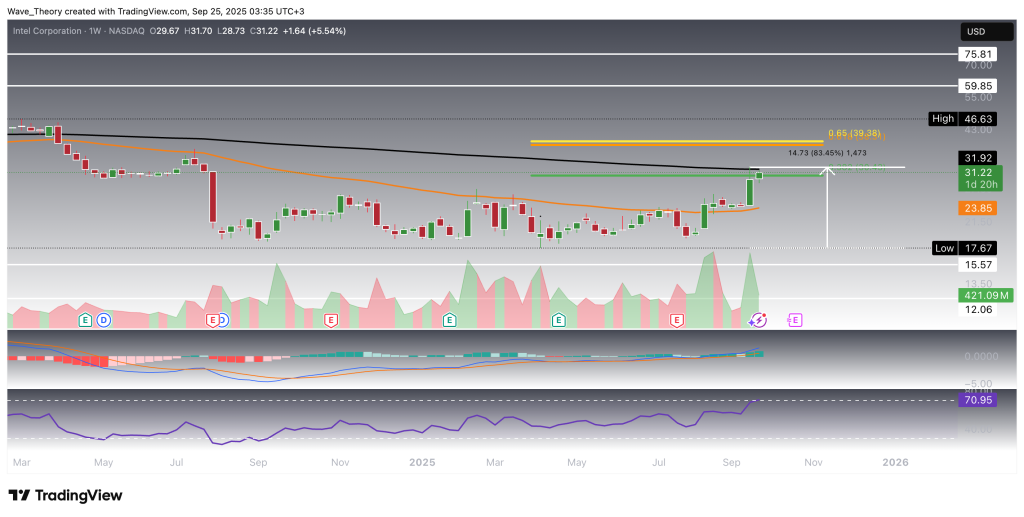
Additional Resistance at the 200-Week EMA
Intel stock is currently testing additional resistance at $31.9, aligning with the 0.382 Fibonacci level. A bullish breakout above this zone could set the stage for a move toward the next key target at $39.
On the technical front, the weekly EMAs remain locked in a death cross, confirming a bearish bias in the medium term. However, momentum is starting to shift: the MACD histogram began ticking higher last week, while the MACD lines are bullishly crossed, pointing to improving underlying strength. Meanwhile, the RSI is hovering near overbought territory, though it provides neither a clear bullish nor bearish signal at this stage.
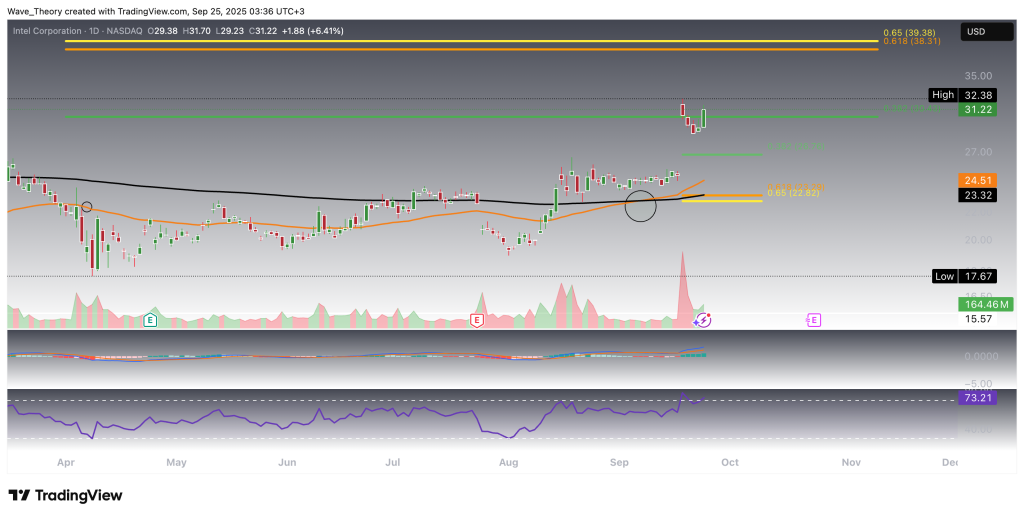
Golden Crossover on the Daily Chart
On the daily chart, Intel has established a golden crossover of the EMAs, confirming the trend bullishly in the short- to medium term. The MACD lines remain bullishly crossed, while the MACD histogram continues to advance in positive territory, further reinforcing the bullish setup. However, the RSI has entered overbought regions, though it shows no signs of bearish divergence at this stage.
Overall, the daily indicators are aligned bullishly. Should Intel face a bearish rejection nonetheless, the next significant Fibonacci support levels can be found at approximately $26.8 and $23.0.
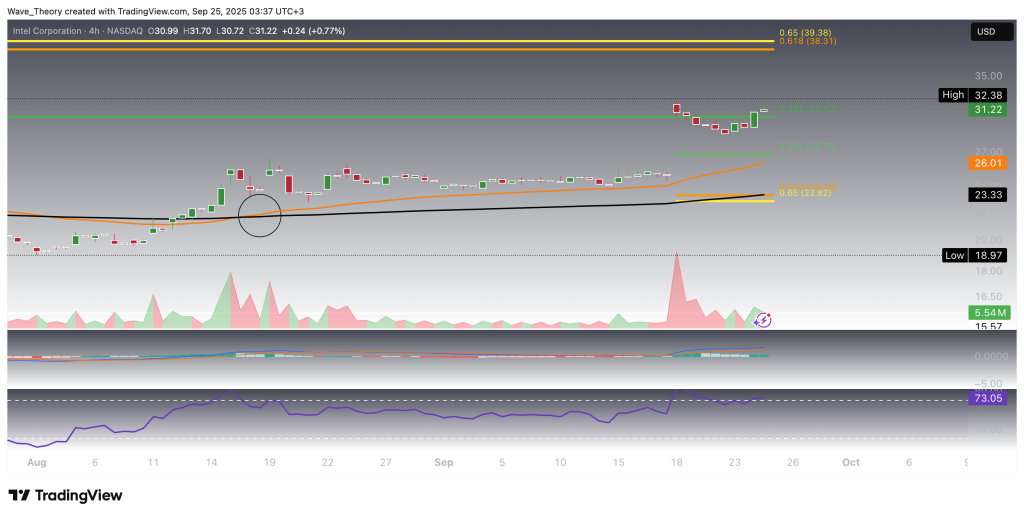
Similar Outlook on the 4H Chart
On the 4H chart, Intel shows a similar bullish structure. The MACD lines remain bullishly crossed, accompanied by a MACD histogram that continues to tick higher, underscoring positive momentum. Supporting this move, the EMAs have formed a golden crossover, confirming the short-term trend to the upside.
Meanwhile, the RSI is trading in slightly overbought territory, though no bearish divergence has developed so far. Should Intel undergo a correction, the 50-EMA ($23.3) and the 200-EMA ($26.0) on the 4H chart are expected to provide significant support, coinciding with key Fibonacci retracement levels.
Intel (INTC) – Key Technical Levels Summary
-
Critical Resistance: $30.4 (0.382 Fib) and $31.9 (200-Week EMA).
-
Next Bullish Targets: $39 (golden ratio), then $60–76 resistance zone.
-
Supports: $26.8 and $23 (Fibonacci levels), reinforced by the 50-4H EMA at $23.3 and 200-4H EMA at $26.0.
-
Indicators:
-
Monthly: EMAs in death cross (bearish), MACD bullish crossover.
-
Weekly: EMAs in death cross, MACD ticking higher.
-
Daily: Golden crossover, RSI overbought.
-
4H: Golden crossover, RSI slightly overbought.
-
- Check out our free forex signals
- Follow the top economic events on FX Leaders economic calendar
- Trade better, discover more Forex Trading Strategies
- Open a FREE Trading Account
- Read our latest reviews on: Avatrade, Exness, HFM and XM
Related Articles


Sidebar rates
Related Posts
