AUD/USD Forecast: Aussie Dives Below 0.6530 as Dollar Strengthens on Tariffs
The Australian Dollar ($AUDUSD) fell hard in Friday’s European session, breaking below 0.6530 as a stronger US dollar...
Quick overview
- The Australian Dollar ($AUDUSD) dropped significantly, falling below 0.6530 due to a stronger US dollar and rising trade tensions.
- Positive US economic data, including a GDP revision and lower jobless claims, contributed to the dollar's rally, while tariffs announced by President Trump heightened risk aversion.
- Local Australian data showed a 3.0% YoY rise in CPI, easing inflation concerns and reducing the likelihood of an RBA rate cut in the near term.
- Technical analysis indicates a bearish outlook for AUD/USD, with key resistance at 0.6620 and potential targets at 0.6500 and 0.6460.
The Australian Dollar ($AUDUSD) fell hard in Friday’s European session, breaking below 0.6530 as a stronger US dollar and trade tensions dominated sentiment. The dollar’s rally was driven by positive US data, with GDP revised to 3.8% in Q2 from 3.3%, durable goods orders up 2.9% in August and initial jobless claims down to 218,000.
Risk aversion increased after US President Donald Trump announced tariffs of up to 100% on patented pharmaceuticals from October 1 if companies don’t shift production to US facilities. The move spooked risk sensitive currencies like the Australian dollar which was already under pressure from diverging monetary policy outlooks.
Australia Data Provides Some Relief
Local data was a bit of a help. Australia’s August CPI rose 3.0% YoY, easing inflation fears and reducing the chances of a near term RBA cut. ASX futures have the probability of a November cut at 50% down from 70% previously. PMI data showed softer but still positive momentum with composite output at 52.1 above 50.
RBA Governor Michele Bullock said labour market is softening but prior cuts should support spending. She said policymakers are prepared to act if conditions deteriorate but current data gives them room to wait.
AUD/USD Technical Breakdown Points Down
The $AUDUSD chart is bearish after failing to hold the ascending channel at 0.6613. A rejection at the 50 day SMA and a series of lower highs confirmed the downside. Candlestick patterns reinforced the move: a shooting star at 0.6685 followed by bearish engulfing candles and a “three black crows” sequence.
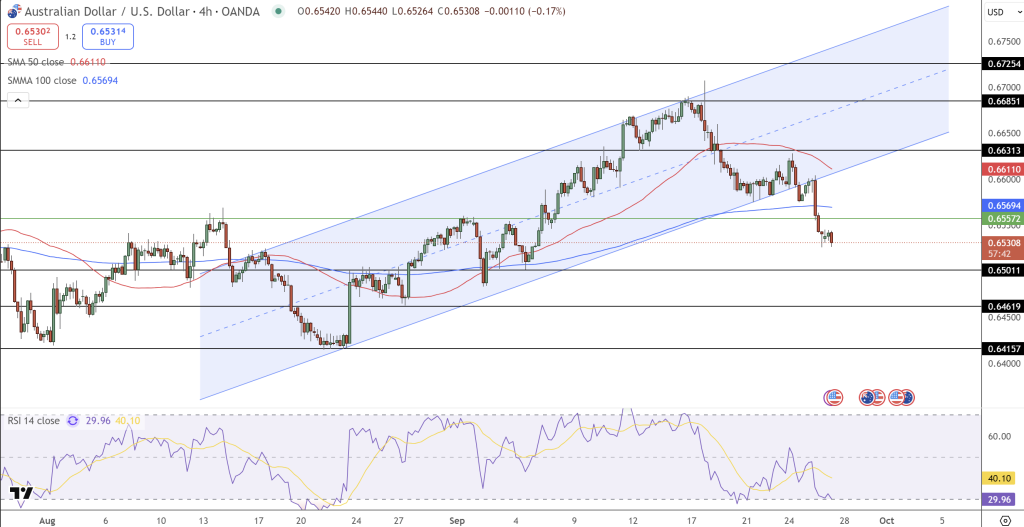
The RSI has fallen below 30, oversold but without bullish divergence, sellers are in control. Both the 50 day SMA and 100 day SMA are sloping down, momentum is down.
- Short entry: 0.6540-0.6550
- Stop loss: Above 0.6620
- Targets: 0.6500 and 0.6460
For traders, the setup is for more weakness unless price gets back above the broken channel. A sustained move above 0.6620 would negate the bearish view. Next week the US PCE is the key.
- Check out our free forex signals
- Follow the top economic events on FX Leaders economic calendar
- Trade better, discover more Forex Trading Strategies
- Open a FREE Trading Account
- Read our latest reviews on: Avatrade, Exness, HFM and XM
Related Articles


Sidebar rates
Related Posts
