Reddit's stock (RDDT) has surged 255% over the past six months but is currently experiencing a 31% correction.
The stock is at a critical juncture, with support at $205 and potential downside to $155 if it fails to hold.
Technical indicators show mixed signals, with bearish momentum on the MACD and neutral RSI suggesting caution.
Key resistance levels are at $222.7 and $252, with a potential return to the all-time high of $283 if these levels are broken.
Reddit’s (RDDT) stock has skyrocketed an impressive 255% over the past six months, drawing significant attention from both institutional investors and retail traders. However, over the last three weeks, the stock has shifted into a notable correction phase — raising the critical question: will Reddit extend its retracement, or is a new bullish leg on the horizon?
Reddit Stock (RDDT) Surged By Almost 255 % In Six Months
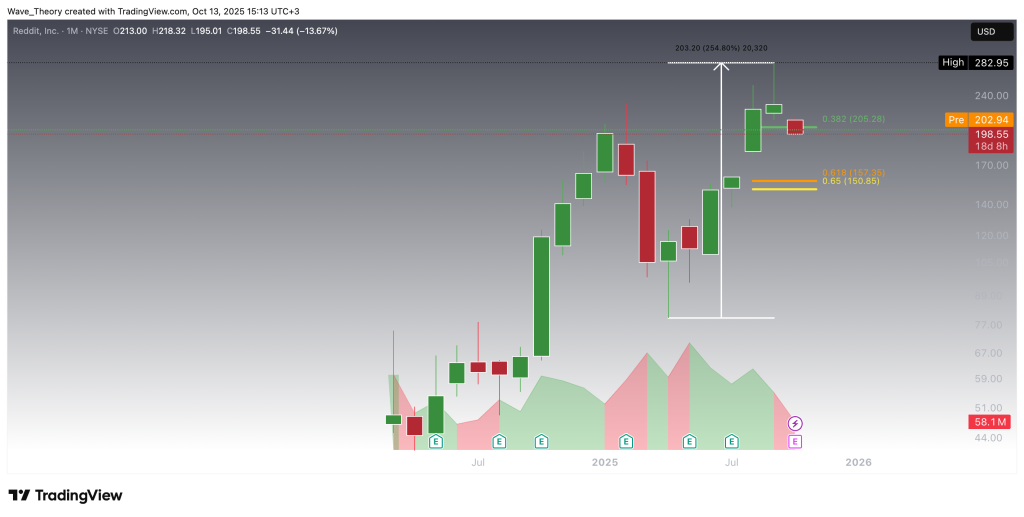
Since its NYSE debut in March 2024, Reddit (RDDT) has demonstrated a remarkably strong uptrend, solidifying its position as one of the standout performers among newly listed tech stocks. Following a pronounced correction in the first quarter of 2025, RDDT rebounded sharply over the subsequent six months, surging approximately 255% and setting a new all-time high at $283. However, after this impressive rally, the stock has recently entered another corrective phase — a typical technical retracement following an overextended advance, as short-term momentum cools and market participants take profits.
Reddit (RDDT)
Reddit Enters Correction Phase; Retraces By 31 %
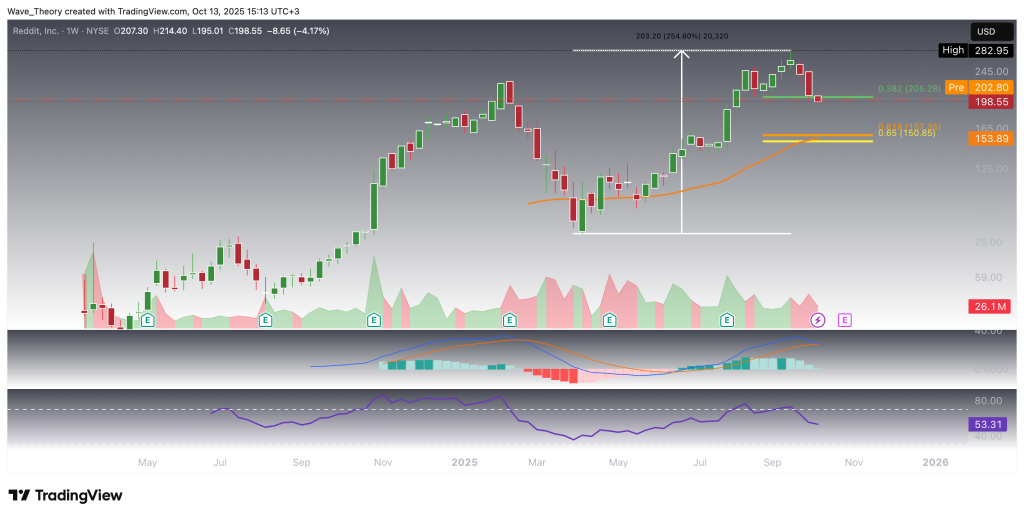
Over the past three weeks, Reddit’s (RDDT) stock has undergone a notable 31% retracement, pulling back to the 0.382 Fibonacci support level at $205. This marks a critical short-term juncture for the stock: if RDDT fails to hold this zone and breaks below it decisively, the next key Fibonacci support lies at the golden ratio of $155, which aligns closely with the 50-week Exponential Moving Average (EMA) — a historically strong dynamic support area. A successful rebound from this confluence could signal the continuation of Reddit’s broader bullish trend.
However, momentum indicators suggest a cautious stance in the near term. On the weekly chart, the MACD lines are on the verge of a bearish crossover, while the MACD histogram has been declining for four consecutive weeks, indicating fading bullish momentum. Meanwhile, the Relative Strength Index (RSI) remains in a neutral zone, implying that although the uptrend is not yet invalidated, buyers are losing control and a deeper correction cannot be ruled out.
Reddit (RDDT)
Reddit (RDDT) Encounters Resistance at 50-Day EMA
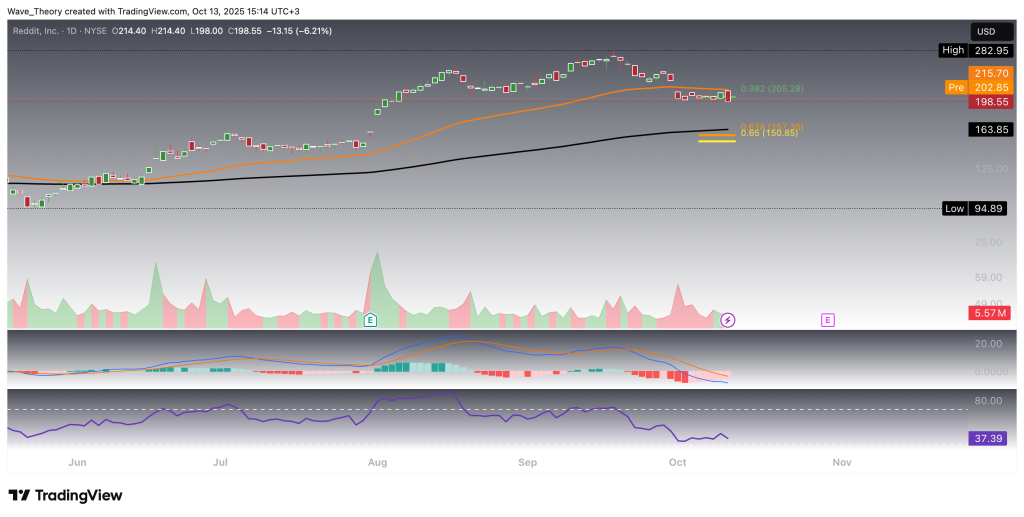
On the daily chart, RDDT maintains a bullish structural backdrop, with the EMAs currently displaying a golden crossover, signaling continued short- to medium-term upward momentum. The MACD histogram has been gradually rising over the past several sessions; however, the MACD lines remain in a bearish cross, indicating that momentum is not yet fully aligned with the trend. The RSI is trading in neutral territory, suggesting no immediate overbought or oversold conditions.
Currently, RDDT faces notable resistance at the 50-day EMA around $216. Should the stock experience bearish rejection at this level, a corrective move toward the key Fibonacci support near $150—the golden ratio retracement—remains a plausible scenario. Traders should monitor price action closely around these technical inflection points to gauge the next directional bias.
Reddit (RDDT)
Will Reddit (RDDT) Return to Its All-Time High?
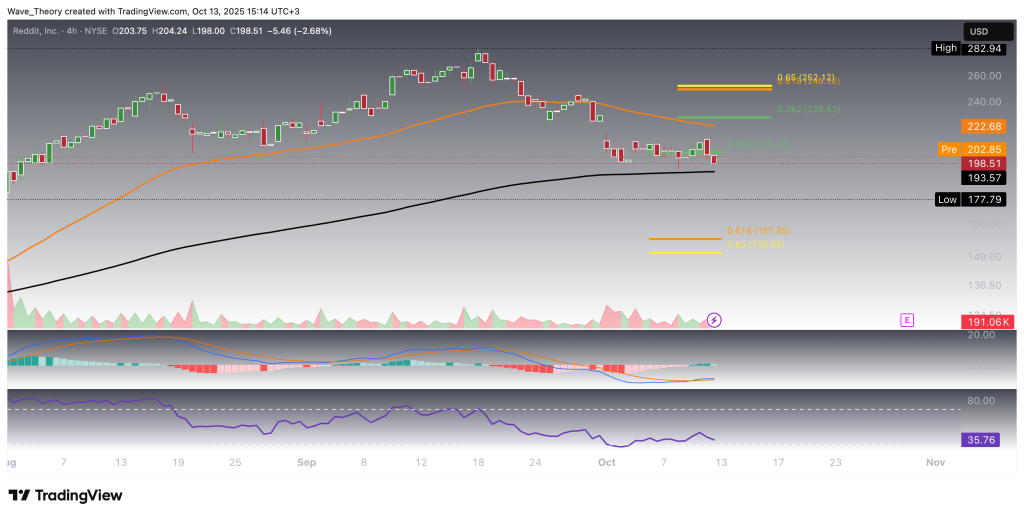
On the 4-hour chart, RDDT currently finds immediate support at the 200-4H EMA around $193.6. A bullish bounce from this level could set the stage for a move toward the 50-4H EMA resistance at $222.7. Should this level be broken decisively, subsequent Fibonacci resistance zones at $228.6 and $252 come into focus. A sustained break above the golden ratio near $252 would open the path for a potential run back to the all-time high around $283. Conversely, failure to hold support could see the stock retreat toward the next key level near $150.
Technically, the 4-hour EMAs remain bullishly crossed, and the MACD lines confirm a short-term bullish trend. However, traders should note that the MACD histogram has begun to tick lower, and the RSI remains in neutral territory, indicating a cautious backdrop for momentum despite the bullish bias.
Reddit (RDDT)
Reddit (RDDT) Technical Summary – Key Levels
Immediate Support: 200-4H EMA at $193.6
Near-Term Resistance: 50-4H EMA at $222.7
Fibonacci Resistance Levels:$228.6 and $252 (golden ratio)
All-Time High Target:$283 if $252 is broken
Major Downside Support:$150
Technical Outlook:
Daily Chart: EMAs in golden crossover, short- to medium-term bullish; MACD lines bearishly crossed, histogram rising; RSI neutral.
4H Chart: EMAs and MACD lines bullishly crossed; MACD histogram shows early bearish tick; RSI neutral.
Summary: RDDT remains in a bullish trend, but key resistance at $222.7–$252 must be cleared for a potential run to the ATH. Failure to hold support at $193.6 could trigger a correction toward $150.
Konstantin Kaiser comes from a data science background and has significant experience in quantitative trading. His interest in technology took a notable turn in 2013 when he discovered Bitcoin and was instantly intrigued by the potential of this disruptive technology.