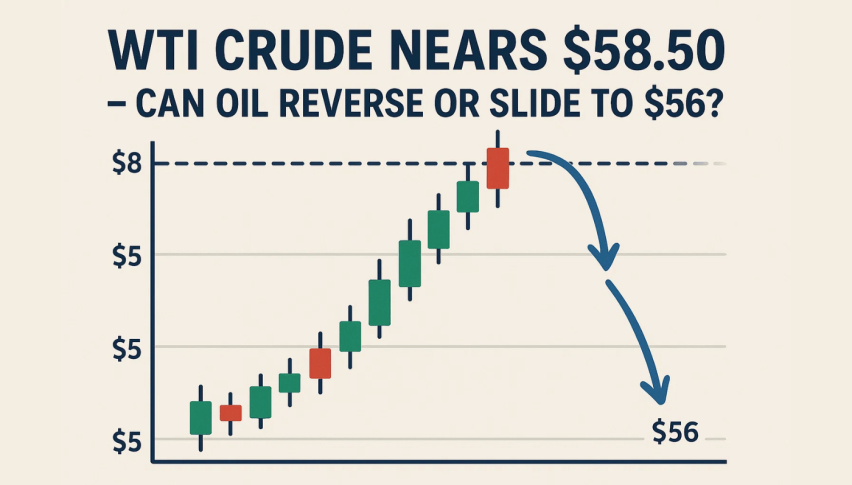
WTI Crude Nears $58.50 — Can Oil Reverse or Slide to $56?”
WTI crude is heading south toward $58.50 per barrel - and fast - as market sentiment takes a turn for the worse. We're now just a whisker...
Quick overview
- WTI crude oil prices are rapidly declining towards $58.50 per barrel, nearing multi-month lows due to negative market sentiment.
- The International Energy Agency warns of a potential global supply glut, with production possibly exceeding demand by 4 million barrels per day next year.
- Technical indicators show a bearish outlook, with oil struggling to break above key resistance levels and hovering around a critical support level of $58.26.
- A cautious trading strategy suggests waiting for a bullish breakout above $59.40 before considering any long positions.
WTI crude is heading south toward $58.50 per barrel – and fast – as market sentiment takes a turn for the worse. We’re now just a whisker away from its multi-month lows. The International Energy Agency is warning of a looming global supply glut, with the potential for output to outpace demand by as much as 4 million barrels per day next year, all thanks to some very robust oil production out of OPEC+ and non-OPEC countries.
Meanwhile, renewed hostilities between the US and China are causing some serious doubt about projected demand, making a lot of people think that energy consumption is going to take a hit. And then there’s the weekly US inventory data – traders are keeping a close eye on all this for any signs that demand is in trouble.
USOIL Technical Landscape: Trendlines & Support Zones
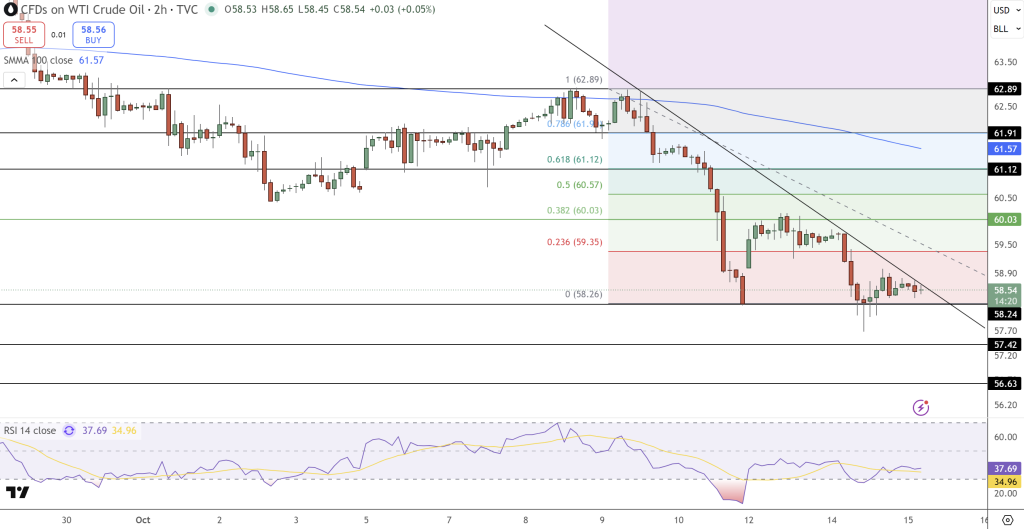
The technical outlook for oil is currently quite gloomy. The price is still below a descending trendline that began at the high of $62.89 on October 9. As long as this trendline remains intact, the bears have control, as evidenced by lower highs, lower lows, and unsuccessful attempts to break above resistance. This situation reinforces a bearish sentiment.
The 100-period Simple Moving Average (SMMA) is currently at $61.57, creating a barrier that prevents oil from making any significant recovery. Despite attempts to rise above this level, oil has been unable to do so.
On the 2-hour chart, the price is hovering around the support level of $58.26. This level was the last key Fibonacci pivot during oil’s decline from $62.89 to $58.26. The presence of spinning tops and Doji candles in this area suggests mixed signals. While bearish momentum may be waning, there isn’t yet a clear reversal in sight.
Additionally, the RSI is at 37, indicating weak momentum, though it hasn’t reached oversold territory just yet. However, if the RSI starts making higher lows while the price tests the support level, it could signal a potential turn in direction.
Crude Oil Trade Setup: Wait for Break or Bounce
Given the current situation here’s a more cautious trade idea for you:
- Entry (bullish breakout): get in above $59.40 – only when oil convincingly breaks through that trend line will we really know if it’s got any legs
- Targets: First thing is $60.55, then $61.10
- Stop-loss: Below $58.20 to make sure you’re protected against further losses
This trade follows a classic break-and-retest strategy: wait for a breakout, then confirm it. Only consider entering if the price is holding above $58.26 and there is confirming divergence. Until then, the bearish bias remains strong.
In summary, WTI oil is currently caught in a logical downtrend, weighed down by concerns over supply and demand. We need to see a sustained move above $59.40 before we can entertain the possibility of a short-term recovery.
- Check out our free forex signals
- Follow the top economic events on FX Leaders economic calendar
- Trade better, discover more Forex Trading Strategies
- Open a FREE Trading Account
- Read our latest reviews on: Avatrade, Exness, HFM and XM
Related Articles


Sidebar rates
Related Posts
