Silver Pullback Offers Buying Opportunity in Strong Uptrend

Quick overview
- Silver's price has dropped approximately 13% in the past week, but it remains in a strong long-term uptrend that began in 2020.
- Over the last five years, silver has surged over 367%, significantly outperforming gold's 202% increase during the same period.
- Despite recent corrections, bullish signals persist on higher timeframes, with key support levels identified around $38 and $27.
- The 4-hour chart shows predominantly bullish signals, suggesting potential upward movement if silver maintains above critical support levels.
The price of silver has retreated by roughly 13% over the past week. Despite this short-term correction, the metal remains in a powerful long-term uptrend that began with the pandemic outbreak in 2020. Since then, silver has surged more than 367%, nearly twice the gain of gold, which rose 202% during the same period.
Silver Shows a Massive Uptrend Over the Last Five Years
Over the past five years, silver has demonstrated a powerful and sustained uptrend, supported by consistently bullish technical signals on the higher timeframes. On the monthly chart, the exponential moving averages (EMAs) have completed a golden crossover, confirming the broader bullish structure and reinforcing long-term upward momentum.
Additionally, the MACD lines remain bullishly crossed, while the MACD histogram continues to build higher, reflecting strengthening positive momentum. Although the RSI has now entered overbought territory, it has yet to generate any bearish divergence or reversal signals — suggesting that, despite elevated levels, the bullish trend remains intact.
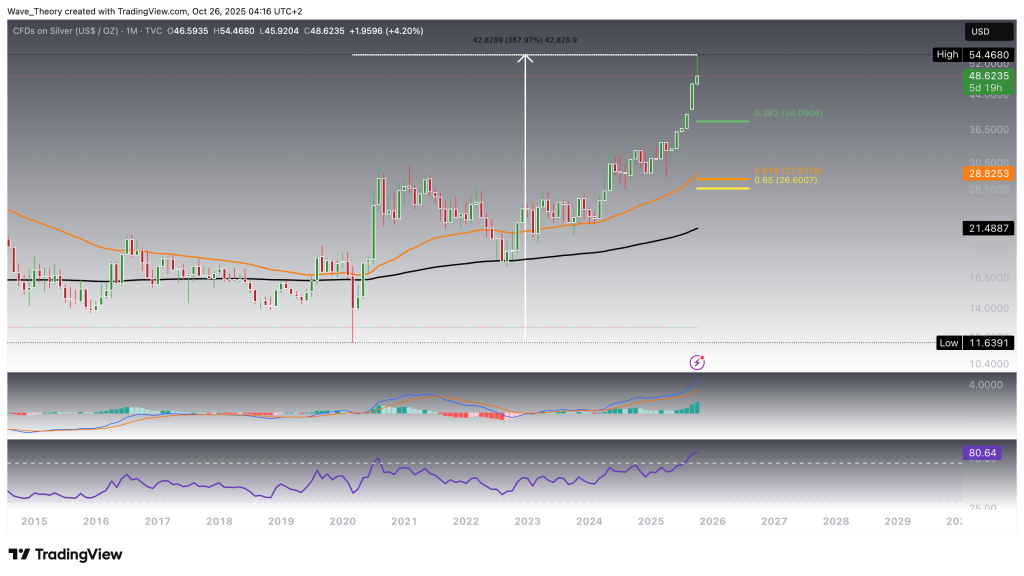
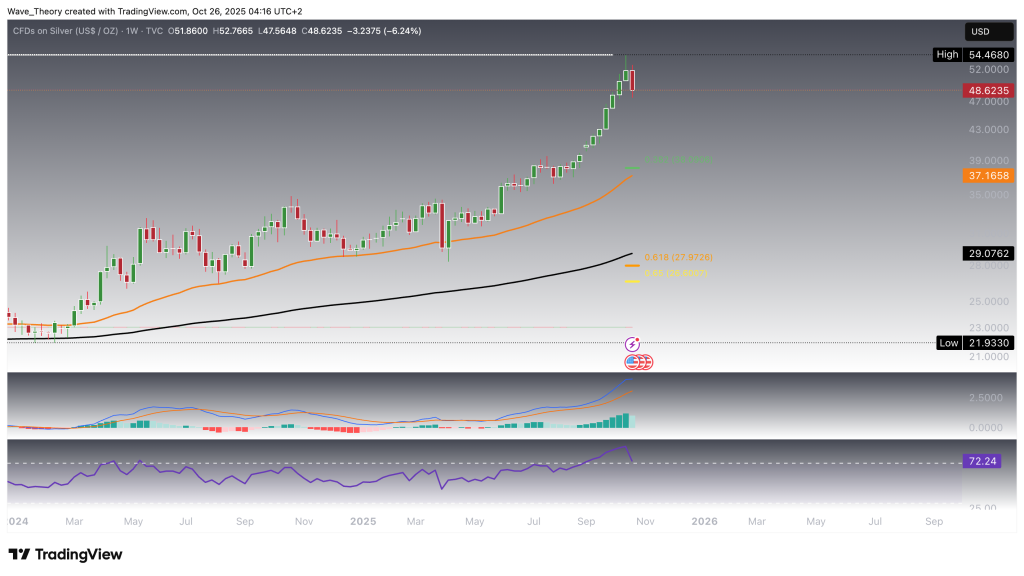
Silver Might Enter a Correction Phase
Despite its strong long-term uptrend, silver has retraced approximately 13% since last week, potentially signaling the onset of a short-term correction phase. The MACD histogram has begun to tick lower this week, indicating a mild loss of bullish momentum. However, both the MACD lines and exponential moving averages (EMAs) remain bullishly aligned, maintaining a positive medium-term outlook.
At the same time, the RSI has eased back toward neutral territory, exiting overbought conditions. Should the correction deepen, key Fibonacci 0.382 support lies near $38, reinforced by the 50-week EMA acting as additional structural support. If this level fails to hold, the next major golden-ratio support zone emerges around $27, with the 200-week EMA providing further confluence near $29.
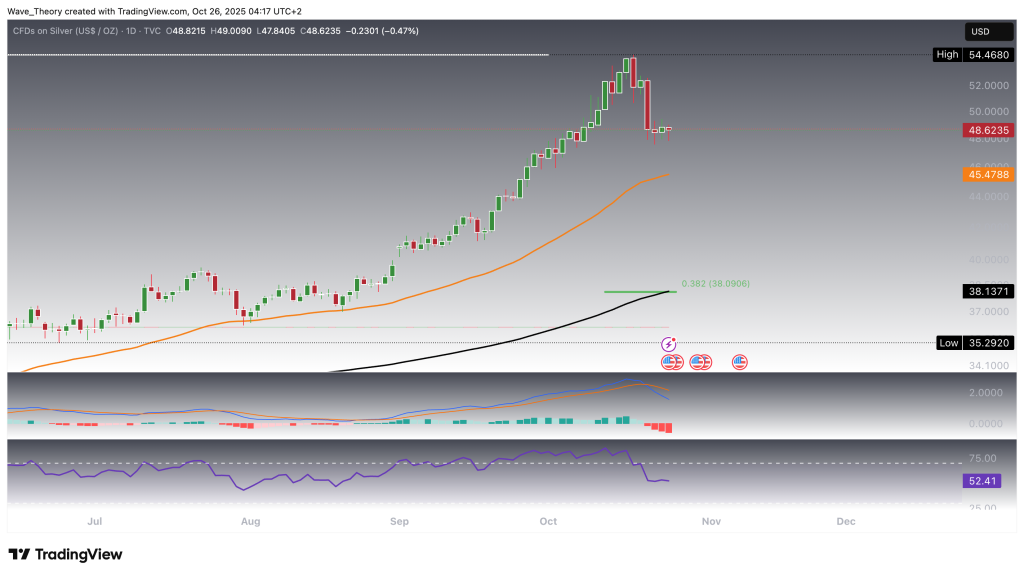
Conflicting Signals on the Silver Daily Chart
On the daily timeframe, silver presents a set of mixed technical signals. The exponential moving averages (EMAs) continue to display a golden crossover, maintaining a bullish bias in the short- to medium-term trend. However, the MACD lines have now crossed bearishly, and the MACD histogram is extending a strong downward trajectory, reflecting weakening momentum. Meanwhile, the RSI remains within neutral territory, offering no clear directional bias.
Should silver continue to decline, immediate support is expected around $45.5, where the 50-week EMA provides the first significant technical cushion.
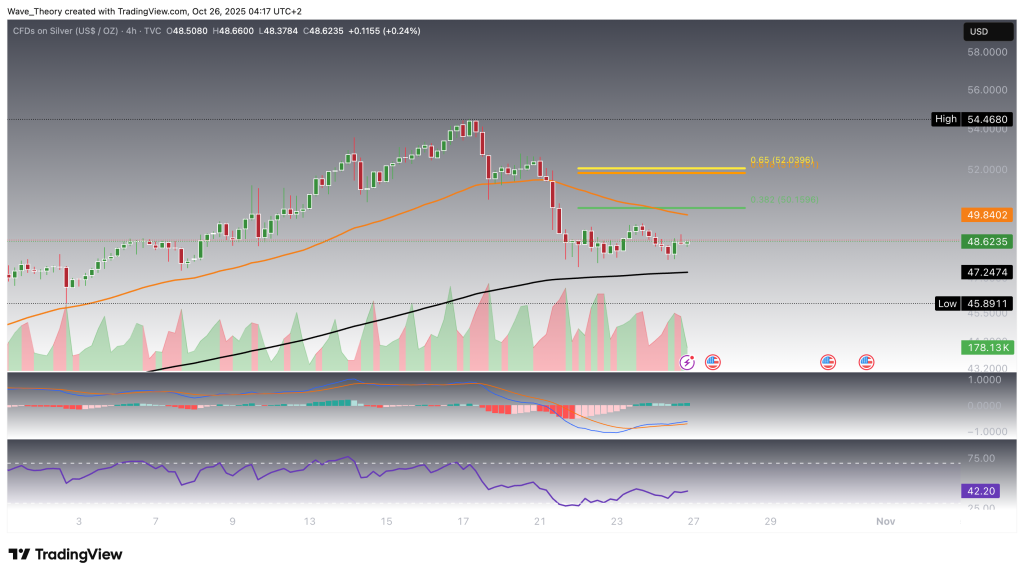
Bullish Signals Strengthen on the 4H Chart
On the 4-hour chart, Silver shows predominantly bullish signals. The EMAs have formed a golden crossover, confirming a short-term bullish trend. The RSI remains in neutral territory, while the MACD lines are bullishly crossed and the histogram indicates upward momentum. If Silver holds above the 200-4H EMA at $47.20, it could soon target the 50-4H EMA at $49.84. Furthermore, Silver faces key Fibonacci resistance levels at $50 and $52. A decisive breakout above the golden ratio at $52 would invalidate the ongoing correction phase and potentially propel Silver toward its all-time high (ATH) — or even higher.
- Check out our free forex signals
- Follow the top economic events on FX Leaders economic calendar
- Trade better, discover more Forex Trading Strategies
- Open a FREE Trading Account
- Read our latest reviews on: Avatrade, Exness, HFM and XM
Related Articles

Sidebar rates
Related Posts
