Oil Price Forecast: WTI Targets $65 as Traders Brace for OPEC Breakout Week
WTI crude holds near $61 as OPEC debates December supply plans. Traders eye a breakout toward $65 amid Russia sanctions and U.S.–China trade
Quick overview
- Oil prices rose slightly on Monday after last week's significant rally, as traders await clarity from the upcoming OPEC supply meeting and U.S.–China trade developments.
- WTI crude is trading around $61.25 and Brent near $65.40, following an 8% increase last week due to renewed sanctions on Russia and strong U.S. demand.
- OPEC+ members are reportedly considering a modest output increase in December, which could impact market dynamics after previous production cuts aimed at capping prices.
- Technical analysis indicates WTI is in a symmetrical triangle pattern, suggesting indecision in the market, with potential breakout levels set at $62.57 for upward movement.
Oil prices edged up on Monday, taking a breather after last week’s rally , as traders waited for some clarity on what the OPECs supply meeting coming up and any fresh news on U.S.–China trade developments.
WTI crude was trading at around $61.25, while Brent hovered near $65.40, both sticking firm after the 8% jump last week that came on the back of renewed sanctions on Russia and stronger demand in the States.
Insiders familiar with OPEC+ talks say eight member countries are leaning towards backing a modest output increase in December, a move that aligns with what Saudi Arabia has been pushing for to try and get a bigger slice of the market back.
This U-turn after a series of production cuts that had been aimed at capping prices raises the stakes.
Sanctions and Demand in Focus
Meanwhile, things were looking up after U.S. Treasury Secretary Scott Bessent said that officials in Washington and Beijing had come up with a “substantial framework” to avoid 100% tariffs on Chinese goods. This was seen as easing fears of trade tensions escalating further, though analysts are still cautious about how this deal is going to be enforced.
At the same time, fresh U.S. sanctions on Russian oil companies are adding to the pressure on supply forecasts. If they are fully enforced, this could cut exports and send oil prices higher.
Demand, meanwhile, remains a real balancing act for the market. Yes, Brent is at its lowest since May, but the States are still eating through oil at a pretty good clip. That’s what’s keeping prices from dropping off a cliff.
‘Bulls are holding out for US demand to keep on recovering,’ said Chris Beauchamp, Chief Market Analyst at IG Bank. ‘If that doesn’t happen, though, then we could be in for a proper correction.’
WTI Technical Analysis: Out of the Compressed Zone?
Techincally, WTI crude is trading inside a symmetrical triangle on the 4 hour chart, which is where the price often goes when there’s indecision in the market. This triangle is basically saying that the price is in a state of suspended animation until the OPEC meeting. It’s got resistance at $62.57 and support near $60.05, creating a pretty tight range.
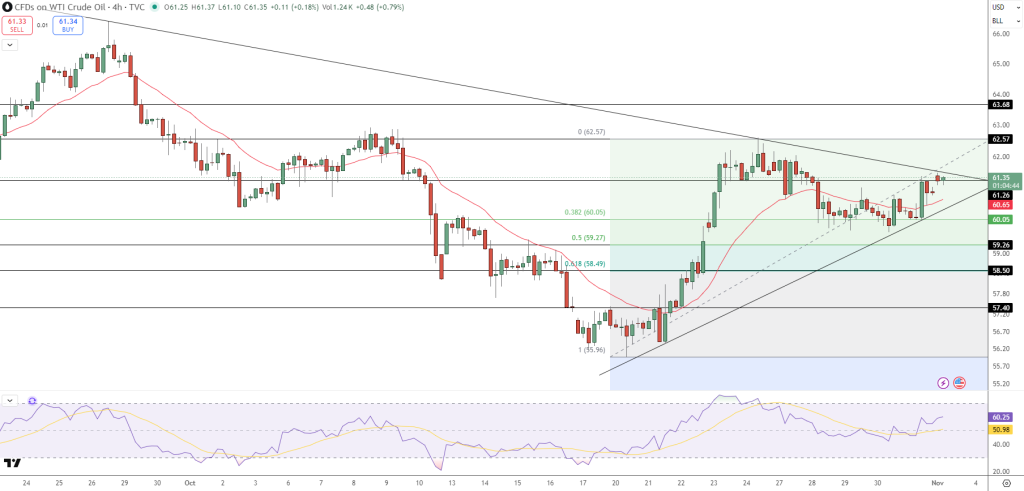
The 20 period EMA is currently sitting at $61.25, which is pretty much exactly in the middle of buyers and sellers. We’re seeing a lot of Doji and spinning top candles on the charts, which shows just how much the price is struggling at the moment. But on the other hand, there are some higher lows being made from the low point in late October at $55.96, which is a sign of a ongoing bullish trend.
The RSI is at 50.9, which says that sentiment is roughly neutral but slowly moving towards being positive. The Fibonacci retracements are also showing that price strength is above the 38.2% level at $60.05.
If WTI can break above $62.57 then it could be heading for some key resistance zones at $63.68 and $65.00. On the flip side, if it breaks below $60.00 then it’s all the way back to $58.50 and $57.40.
WTI Crude Oil Trade Setup and Outlook
In the short term, we’re looking at a buy on a breakout strategy, with eyes set on $63.68 – $65.00 and stops below $60.00. We’re expecting volatily to increase as we near the OPEC supply decision and the 4 hour chart is saying that things are about to get a lot more directionally clear.
If we do see a breakout and it’s in line with the trade and sanctions news, then oil could be back on the way up and heading for the $65 level, which would represent a return to the highs we saw back in September.
- Check out our free forex signals
- Follow the top economic events on FX Leaders economic calendar
- Trade better, discover more Forex Trading Strategies
- Open a FREE Trading Account
- Read our latest reviews on: Avatrade, Exness, HFM and XM
Related Articles


Sidebar rates
Related Posts
