Ethereum Struggles at $3,300, Bulls Lose Momentum Despite Record Network Performance
Ethereum is trading at about $3,300 right now, which is down more than 2.6% in the last 24 hours. Bears are still in charge after an attempt
Quick overview
- Ethereum is currently trading at approximately $3,300, down over 2.6% in the last 24 hours, indicating a bearish trend.
- Technical analysis suggests further downside risk, with ETH testing support at $3,300 and facing resistance at $3,380.
- Despite negative technical indicators, a significant drop in Ethereum's exchange reserves may indicate potential long-term bullish sentiment.
- Retail sentiment has shifted rapidly, with traders becoming overly bullish, which could lead to market corrections in the near future.
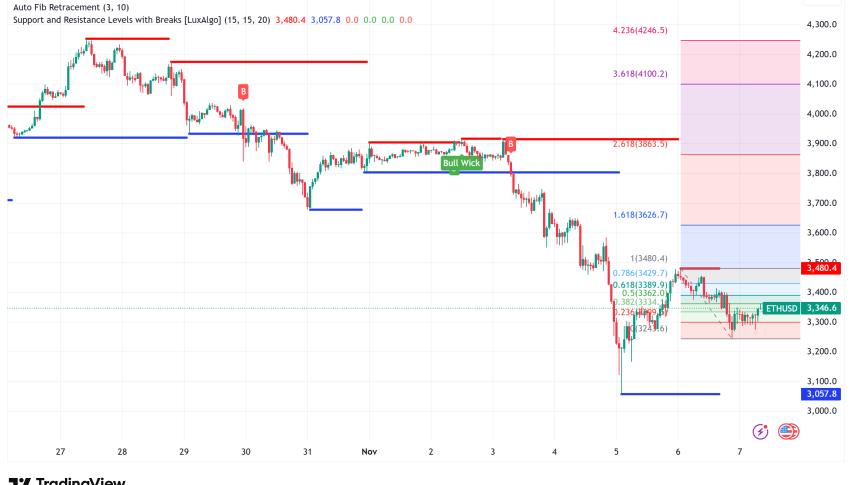
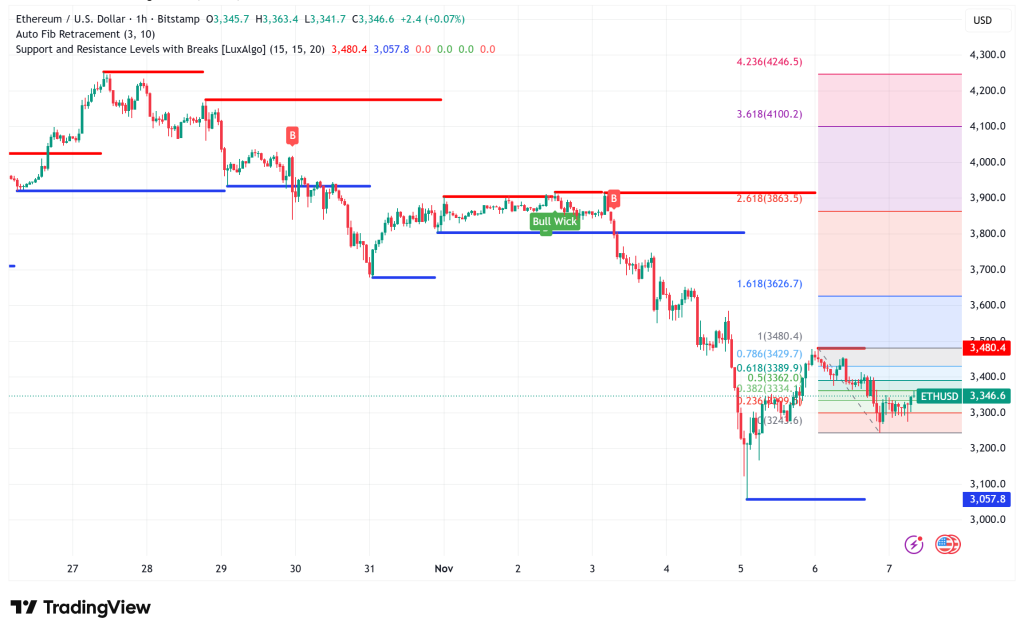
Ethereum ETH/USD is trading at about $3,300 right now, which is down more than 2.6% in the last 24 hours. Bears are still in charge after an unsuccessful attempt to rebound from the $3,480 resistance level. The second-largest cryptocurrency has entered a new bearish phase after failing to keep its momentum over the important $3,450 level.
ETH/USD Technical Breakdown Suggests Further Downside Risk
Technical analysis shows that things don’t look good for short-term traders. ETH has dropped below its 100-hour Simple Moving Average and is now testing support at $3,300. A new bearish trend line is keeping it from going higher at $3,380. The Relative Strength Index (RSI) on the daily chart has dropped to 32, which is close to being oversold. The Moving Average Convergence Divergence (MACD) indicator has been giving a sell signal since Monday.
The price movement shows that bears were able to protect the 50% Fibonacci retracement level between the most recent swing high of $3,920 and the low of $3,058. If bulls try to start another recovery wave, they will run into opposition right away around $3,350, and then again at the important $3,380 trend line. To change the momentum, the price would have to break over $3,480. This might lead to $3,580 and the 61.8% Fibonacci barrier.
ETH Exchange Reserve Squeeze Offers Silver Lining
Even though the technical setting is negative, on-chain data shows that there may be a bullish fundamental development. As of Wednesday, Ethereum’s balance on exchanges has dropped to only 13.3 million ETH, the lowest amount in nine years. According to Glassnode data, this is a huge drop from the peak of almost 35.5 million ETH in August 2020.
The continued drop in exchange reserves shows that holders are still accumulating as they move their assets to self-custody or staking platforms. This trend makes the supply on the open market smaller, which might ease downward pressure and set the stage for prices to rise when sentiment improves.
But this good supply trend is very different from the signs of falling demand. On Wednesday, US-listed Ethereum spot ETFs saw a lot of money leave, over $119 million. BlackRock’s ETHA led the way with $147 million in withdrawals. Only three of the nine ETH ETFs saw money come in, bringing the total net assets to about $22.74 billion.
Retail Sentiment Shifts Too Quickly
Adding to the uncertainty, retail trader sentiment has changed a lot. Social media data shows that Ethereum traders went from being very negative to quite bullish overnight, which is bad news for those who want to go against the crowd. When ETH almost went back up to $3,500 yesterday, crowd FOMO grew stronger. This is something that usually happens before market corrections.
Futures Open Interest has dropped from over $63 billion in October to $38.6 billion now. This could mean that traders are reducing long bets, which could make selling pressure stronger.
Ethereum Price Prediction: Cautious Outlook for November
Ethereum is likely to have a lot of trouble in the near future because of the way things are right now. If the $3,300 support level doesn’t hold, the first target for the downside is $3,250, and the next major support level is $3,220. If the price drops below this zone, losses could speed up toward $3,150. The next line of defense is the important $3,050-$3,000 area.
For bulls to get back in charge, ETH needs to break through the $3,380 resistance and the 200-day Exponential Moving Average at $3,599. If the price stays over $3,650 for a long time, it would mean that the trend has really changed and could reach $4,000 in the longer term.
The most likely thing to happen for the rest of November is that the market will stay between $3,000 and $3,500, with a minor bearish tendency. Weakening institutional demand, quick changes in sentiment, and bearish technical indications all point to limited upside until the market settles down. But the fact that exchange reserves are at their lowest level in nine years is a good long-term sign once the current selling pressure goes away.
- Check out our free forex signals
- Follow the top economic events on FX Leaders economic calendar
- Trade better, discover more Forex Trading Strategies
- Open a FREE Trading Account
- Read our latest reviews on: Avatrade, Exness, HFM and XM
Related Articles


Sidebar rates
Related Posts
