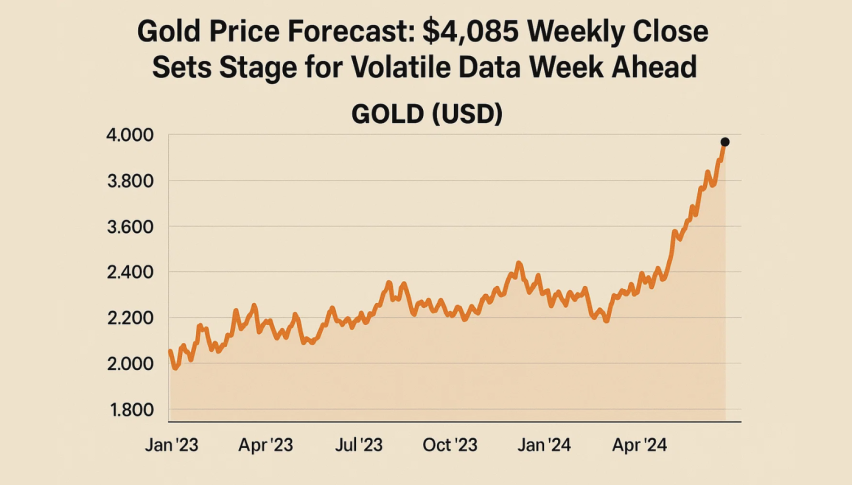
Gold Price Forecast: $4,085 Weekly Close Sets Stage for Volatile Data Week Ahead
Gold ended the week at $4,085, slipping out of its two-week uptrend just as the US dollar steadied ahead of a heavy macro calendar.
Quick overview
- Gold closed the week at $4,085, breaking its two-week uptrend as the US dollar steadied.
- Upcoming US economic data releases could significantly impact gold prices and market sentiment.
- Technical analysis shows gold struggling beneath key resistance levels, indicating potential volatility ahead.
- Traders are advised to consider bearish setups if gold retests resistance, while a bullish scenario requires a strong close above $4,168.
Gold ended the week at $4,085, slipping out of its two-week uptrend just as the US dollar steadied ahead of a heavy macro calendar. The pullback broke a clean ascending channel, suggesting the metal may face more volatility before finding direction. With several top-tier US releases on deck, gold now sits at a key turning point.
Events Ahead: Data That Could Shake the Dollar
The coming week carries several releases that historically trigger sharp intraday moves in gold, USD pairs, and equities.
Monday:
- Empire State Manufacturing Index expected at 6.1, sharply lower than the previous 10.7, pointing to cooling activity.
Tuesday:
- FOMC member Waller speaks, offering potential clues on inflation and rate expectations.
Wednesday:
- FOMC Meeting Minutes — the most important release of the week — should detail policymakers’ debate around future easing after recent soft data.
Thursday:
A densely packed session:
- Average Hourly Earnings m/m: 0.3% forecast vs 0.0% prior
- Non-Farm Employment Change: 22K forecast, unchanged
- Unemployment Rate: steady at 4.3%
- Philly Fed Manufacturing: –1.4 forecast vs –12.8 previous
- Existing Home Sales: 4.11M vs 4.06M prior
Friday:
- Flash Manufacturing PMI: 52.5 forecast
- Flash Services PMI: 54.8 forecast
- Revised UoM Sentiment: 50.3 expected
This lineup will set the tone heading into late November, especially if labor or inflation data surprise.
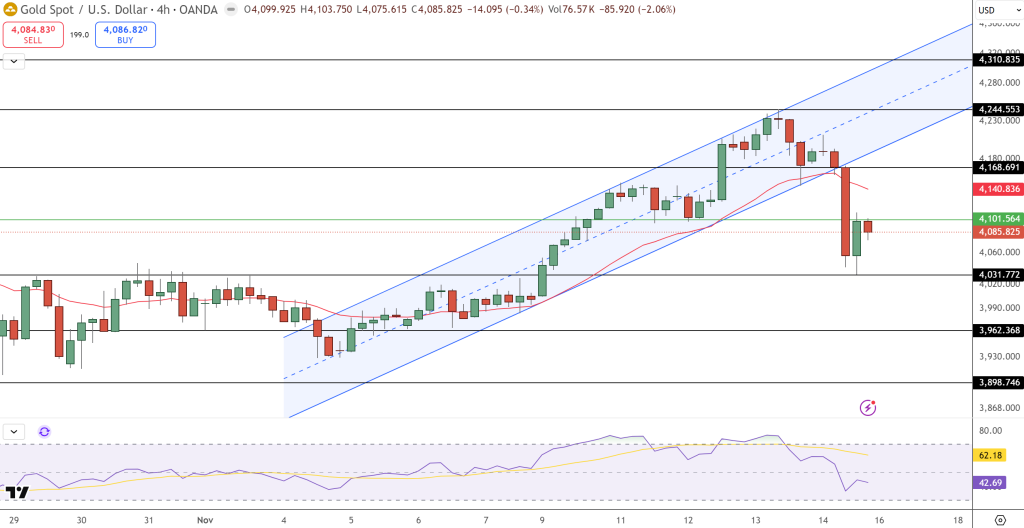
Gold Price Analysis: Trend Break Signals Caution
Gold’s chart turned sharply lower after a textbook rejection near $4,244, forming a shooting star followed by a bearish engulfing candle. The metal sliced through the 20-EMA and exited its ascending channel decisively, a signal that the prior trend has lost momentum.
Price is now struggling beneath $4,101–$4,140, a former support zone that has flipped into resistance.
The RSI slipped from 62 to the low 40s, showing weakening momentum and no bullish divergence. The next support levels are $4,031 and $3,962, both tied to earlier consolidation zones.
Trade Outlook: Clean Setups for New Traders
Bearish Scenario (Preferred): A retest of $4,101–$4,140 followed by a rejection candle (shooting star, Doji, or bearish engulfing) offers a low-risk short.
- Entry: $4,115–$4,135
- Stop: Above $4,168
- Targets: $4,031 and $3,962
Bullish Alternative: A strong close above $4,168 reopens the channel toward $4,244. Until that level is reclaimed, sellers remain in control.
- Check out our free forex signals
- Follow the top economic events on FX Leaders economic calendar
- Trade better, discover more Forex Trading Strategies
- Open a FREE Trading Account
- Read our latest reviews on: Avatrade, Exness, HFM and XM
Related Articles

Sidebar rates
Related Posts
