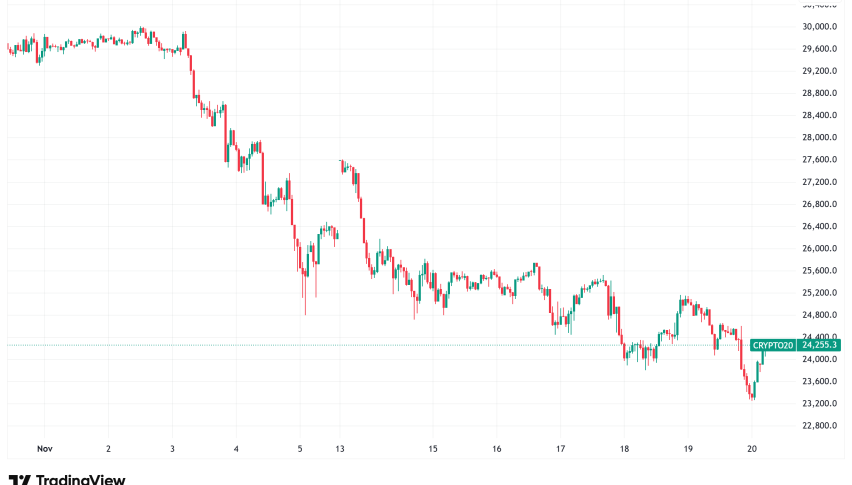
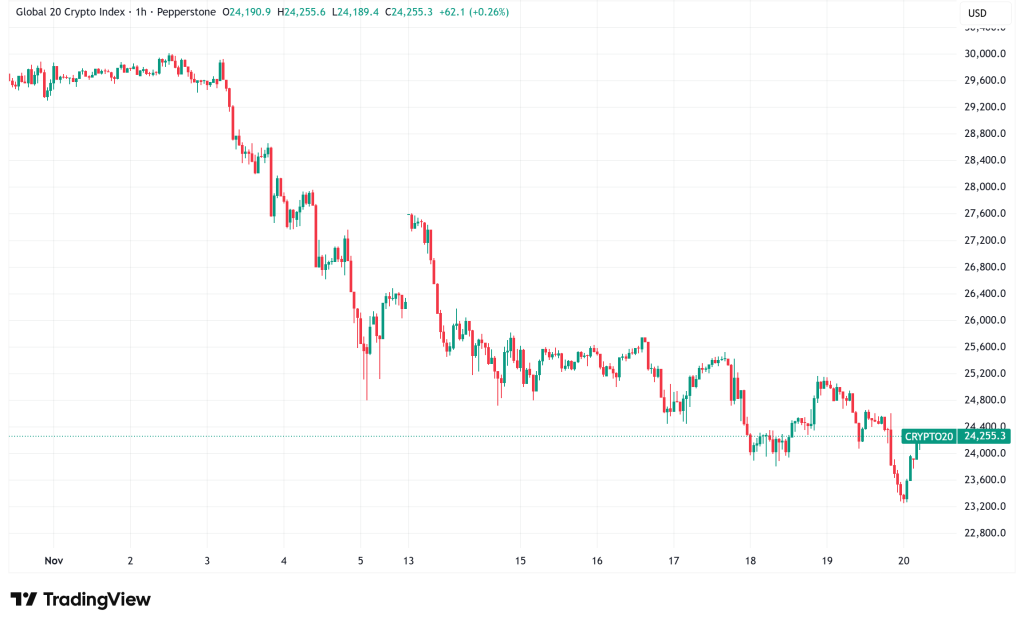
Daily Crypto Signals: Bitcoin and XRP Face Headwinds as Kraken Eyes IPO
Bitcoin's SuperTrend indicator has triggered a bearish sell signal that historically preceded 77-84% price drops, while XRP risks a 25% drop
Quick overview
- Bitcoin's SuperTrend indicator has issued a bearish sell signal, historically leading to significant price drops of 77-84%.
- XRP is at risk of a 25% decline to $1.55 due to slumping network activity and bearish technical indicators.
- Kraken has confidentially filed for a U.S. IPO after securing $800 million in funding, highlighting significant industry developments.
- Global banking regulators are reconsidering stringent crypto capital requirements following pushback from the U.S. and U.K.
Bitcoin’s BTC/USD SuperTrend indicator has triggered a bearish sell signal that historically preceded 77-84% price drops, while XRP XRP/USD risks a 25% decline to $1.55 as network activity slumps and technical indicators flash warning signs. Meanwhile, Kraken has filed confidentially for a U.S. IPO just hours after securing $800 million in funding, and global banking regulators are reconsidering their stringent crypto capital requirements following resistance from the U.S. and U.K.
Crypto Market Developments
The cryptocurrency market is dealing with a lot of changes in the rules and adverse technical signs. Kraken’s secret file for an initial public offering is a big deal for the industry. It comes after a $800 million investment round that valued the exchange at $20 billion. The timing is interesting because the submission comes after a 43-day government shutdown in the U.S. that delayed SEC reviews of these kinds of petitions.
There may be a change in how global banking is regulated. Erik Thedéen, head of the Basel Committee on Banking Supervision, told the Financial Times that authorities could need to rethink the 1,250% risk weighting for crypto holdings after the US and UK declined to follow the strict rules. The current system sees stablecoins like Tether and USDC as having the same level of risk as the riskiest venture investments. This means that banks have to keep their own money equal to the whole amount of their crypto holdings.
There is a lot of support for new laws in Washington. For example, Tim Scott, the chair of the Senate Banking Committee, said he will mark up a bill about the structure of the crypto market in December. Scott wants to have a bill on President Trump’s desk by early 2026, making the U.S. what he terms “the crypto capital of the world.” The House enacted the CLARITY Act in July. It defines the regulatory powers of the CFTC and the SEC. The Senate is now working to make its version match the House measure.
Bitcoin Showing Signs of Further Bearish Moves?
Bitcoin is showing some technical signs that have traditionally marked the start of extended bear markets. Last week, the cryptocurrency’s SuperTrend indicator gave a sell signal on its weekly chart. This has happened before, and it has led to huge drops. These two indications, when verified by a weekly closure below the 50-week moving average, have caused 84% drops in 2018 and 77% drops in 2022.
The SuperTrend indicator, which analyzes price movements and includes average true range calculations, changed from red to green and climbed above Bitcoin’s price, which is a classic bearish pattern. Bitcoinsensus, a crypto analyst, said that this is the first warning of this kind since January 2023, when the last bear market ended. If past trends hold, Bitcoin might drop to as low as $75,000 because there is less demand from Bitcoin treasury businesses and U.S.-based spot ETFs keep selling their shares.
The Crypto dread and Greed Index has dropped to 11, its lowest level since February, which adds to the pessimistic mood. This puts it in the “extreme fear” range. Based on how similar situations have played out in the past, there are two possible outcomes: either Bitcoin goes through more pain in the near future before eventually reaching new all-time highs, like it did in 2021 when the index stayed low for three months before a 40% drop led to a rally to $69,000, or the market goes into a full-blown bear market like it did in May 2022, when Bitcoin crashed to $15,000 and fear stayed high until July.
Market analysts say that there is likely to be pain in the short term, but there is also a chance of a turnaround in two to three weeks. However, just because mood is low doesn’t mean that new all-time highs are impossible in the medium run. Bitcoin investors should be careful right now since technical indicators and sentiment measures are all pointing in the same direction.
XRP Technical Breakdown Risks 25% Decline
XRP is facing its own problems, and technical analysis and on-chain indicators show that there is a lot of downside risk. The token’s eight-hour chart shows that it has confirmed a descending triangle pattern. This happened when it fell below the $3 psychological mark in October. This bearish pattern, which included a flat support line and a downward-sloping resistance line, ended when XRP fell below support at $2.20 on Monday. This set a measured goal of $1.55, which would be a 25% drop from the current level of roughly $2.11.
A negative divergence between XRP’s price movement and its relative strength index makes the technical picture even more difficult. XRP made higher highs between November 2024 and July 2025 in a rising channel. At the same time, the weekly RSI fell from 92 to 68, making lower highs. These kinds of differences usually mean that the current uptrends are getting weaker as more people take profits and buyers get tired. The RSI has since dipped to 39, which means that market circumstances still favor going down. The 50-week simple moving average at $2.32 is a strong barrier above.
The big drop in activity on the XRP Ledger network over the past four months may be the most worrisome thing for XRP’s short-term future. Daily active addresses have dropped sharply from a high of 577,000 on June 14 to about 44,000 now. This is a big drop that suggests fewer transactions by users and possibly less trust in XRP’s future. New addresses have also dropped to about 4,000 a day from 13,500 on November 10. This shows that fewer people are using the network and getting involved.
The Glassnode distribution heatmap shows another problem: a big supply cluster between $2.38 and $2.40, where about 3.23 billion XRP were bought, making it a strong resistance zone. In the past, when network activity goes down, prices tend to stay the same or go down. This is because fewer transactions make the market less liquid and buying momentum slows down. These are two things that make XRP more likely to sell off right now.
- Check out our free forex signals
- Follow the top economic events on FX Leaders economic calendar
- Trade better, discover more Forex Trading Strategies
- Open a FREE Trading Account
- Read our latest reviews on: Avatrade, Exness, HFM and XM
Related Articles

Sidebar rates
Related Posts
