Silver Price Steady Near $51 After Key Rebound: Bulls Eye a Breakout Move Ahead
Silver is beginning to steady after last week’s volatility, reclaiming some structure above the $50.43 support zone...
Quick overview
- Silver is stabilizing above the $50.43 support zone, indicating a cautious market transition.
- Indecisive candles suggest a pause in momentum rather than panic, with the 20-EMA flattening signaling consolidation.
- A break above $52.19 could shift momentum back to buyers, targeting $53.23 and $54.42.
- Traders should watch for a breakout-retest strategy, with critical support at $50.40 if prices slip.
Silver is beginning to steady after last week’s volatility, reclaiming some structure above the $50.43 support zone — an area that’s sparked several rebounds this month. Price action on the 2-hour chart shows the metal still tracking a rising trendline drawn from late October, hinting that buyers aren’t giving up control even as momentum slows. The setup reflects a market in transition: cautious, but not weak.
Momentum Softens, but Structure Holds
Across the chart, traders are watching a cluster of indecisive candles — spinning tops, small bodies, and mild rejection wicks. These aren’t signs of panic; they’re signs of a market taking a breath. The 20-EMA has flattened for the first time in two weeks, reinforcing the idea of consolidation rather than trend reversal. RSI sits near 50 with no divergence, often the point where markets gather energy before a decisive move.
[[XAG/USD-graph]]
Key observations include:
- Price holding above the rising trendline
- RSI neutral but stable near mid-range
- 20-EMA flattening, signaling reduced selling pressure
Silver (XAG/USD) What the Bulls Need to Regain Control
A clean break above $52.19 would shift momentum back toward buyers. If that move aligns with a bullish engulfing candle, silver could push toward $53.23 and potentially retest $54.42, last week’s swing high. Until that level breaks, the market remains balanced, with neither side in full control.
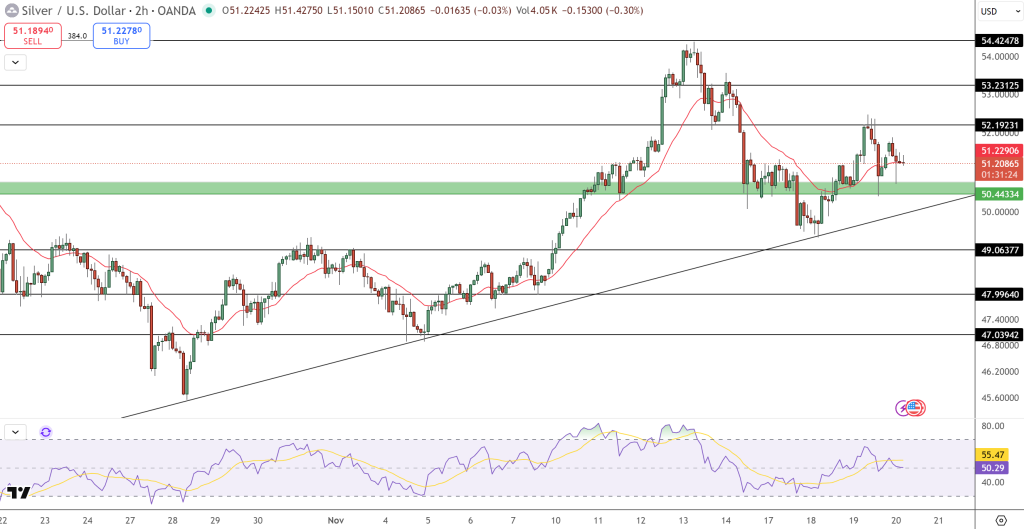
If price slips, the trendline near $50.40 becomes a critical defense. A firm break beneath it exposes support at $49.06, a level that would likely attract value hunters.
Silver (XAG/USD): Trade Setup
For beginners, the simplest strategy is a breakout-retest approach. If silver breaks above $52.20, waits for a pullback, and prints a bullish candle, it signals buyers stepping in with conviction. Stops can sit under $51.70, with targets at $53.20 and $54.40. Aggressive traders may take the opposite side: a rejection candle at $52.20, such as a shooting star or bearish engulfing, can justify a short aimed at $50.40. The market is coiling. Once the stalemate breaks, silver’s next trend may unfold quickly.
- Check out our free forex signals
- Follow the top economic events on FX Leaders economic calendar
- Trade better, discover more Forex Trading Strategies
- Open a FREE Trading Account
- Read our latest reviews on: Avatrade, Exness, HFM and XM
Related Articles

Sidebar rates
Related Posts
