Tilray (TLRY) Stages a Comeback — Key Levels and Outlook

Quick overview
- Tilray's stock has rebounded approximately 400% from its lows, currently trading around $12.15 after a dramatic decline from nearly $3,000.
- The stock recently surged from $3.51 to $23.10 before retracing to $6.90, indicating high volatility and speculative trading.
- Key resistance levels are identified at $13.13 and $17.50, which will be crucial for determining the stock's future momentum.
- Despite a bullish short- to medium-term trend, mixed signals from momentum indicators suggest caution as Tilray navigates a consolidation phase.
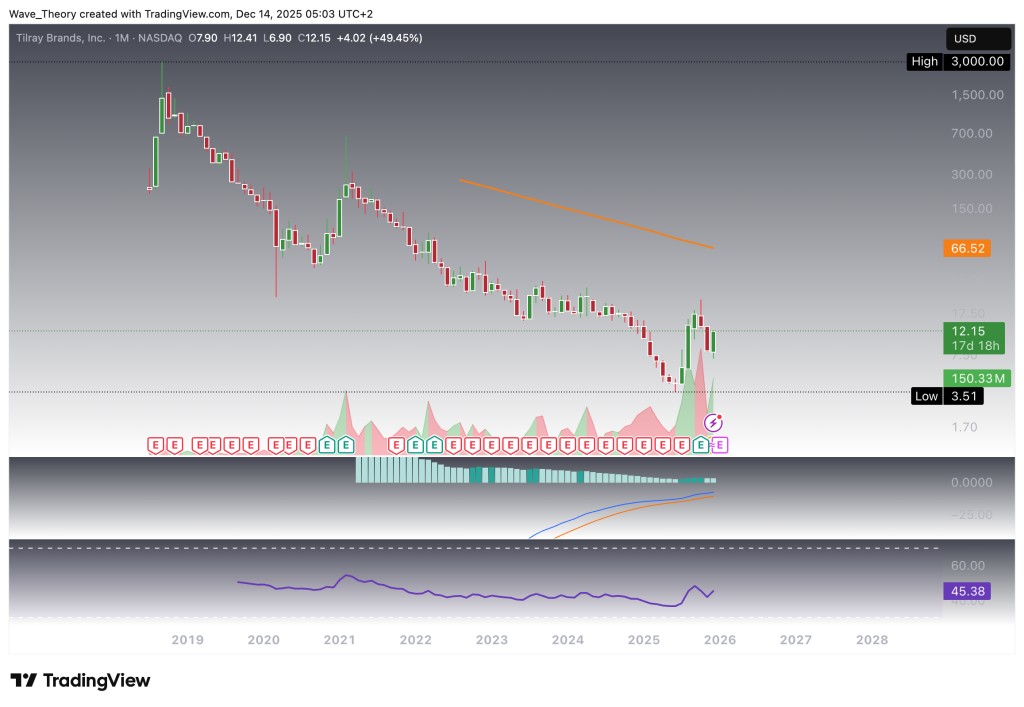
Tilray (TLRY) has endured one of the most dramatic collapses in modern market history, plunging from nearly $3,000 to just $3.51 over the past seven years. Now trading around $12.15, the stock has staged an impressive ~400% rebound from its lows, reigniting debate over whether this move marks the beginning of a sustainable trend reversal—or merely a powerful counter-trend rally.
Tilray Stock Surged From $3.51 to $23.10, Then Retraced to $6.90
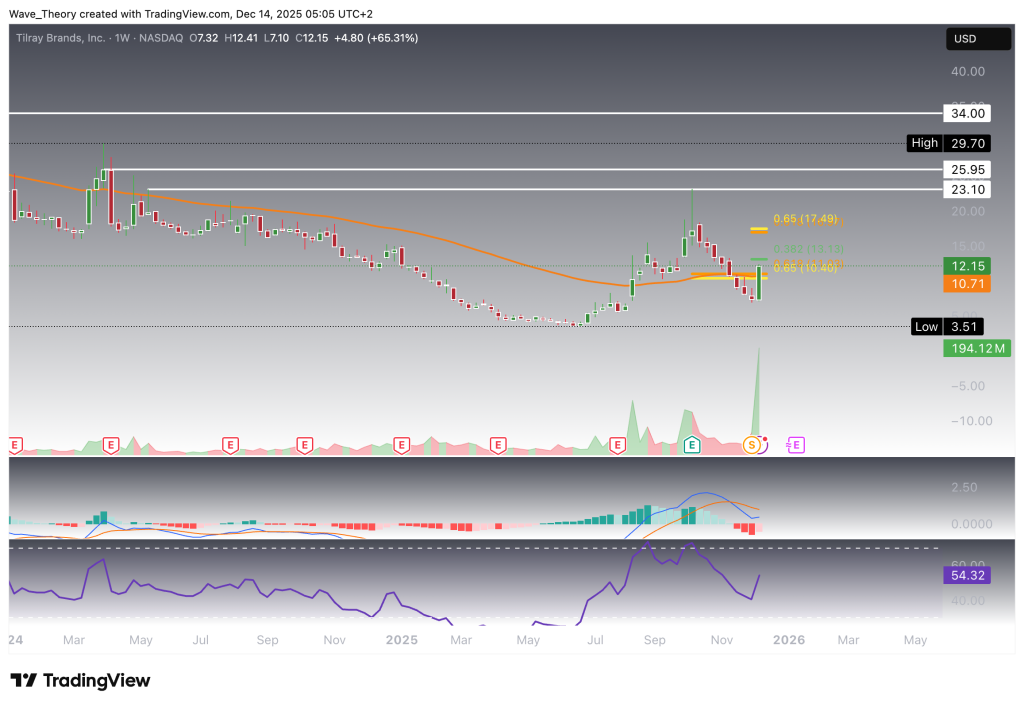
Tilray delivered an explosive rally from $3.51 to $23.10 between June and October, marking a powerful speculative advance. This move was followed by a severe corrective phase, with the stock retracing sharply back to $6.90. Since establishing that low, Tilray has mounted a strong recovery, doubling in price and currently trading around $12.15.
On the monthly chart, momentum indicators present a mixed technical picture. The MACD lines remain bullishly crossed, supporting a constructive longer-term momentum structure. However, the MACD histogram has been ticking bearishly lower since last month, signaling a loss of upside momentum following the rebound. Meanwhile, the RSI remains in neutral territory, offering no definitive bullish or bearish confirmation at this stage.
Overall, Tilray is transitioning from a high-volatility recovery phase into a consolidation zone, with momentum indicators suggesting caution despite the strong rebound from the lows.
Tilray Stock Faces Major Resistance at $13.13 and $17.50
Tilray is currently navigating a critical technical zone. On the indicator side, the MACD lines remain bearishly crossed, reflecting lingering downside pressure. However, the MACD histogram has begun ticking bullishly higher this week, signaling a potential early momentum shift. Meanwhile, the RSI remains in neutral territory, offering no decisive directional bias at this stage.
From a price-structure perspective, Tilray previously broke below the golden ratio support at $10.40, a technically significant event. Despite this breakdown, the stock has staged an impressive rebound over the past week, regaining momentum and reclaiming higher levels. As a result, Tilray now faces key Fibonacci resistance levels at $13.13 and $17.50, which will act as major hurdles for further upside continuation.
A decisive break above these resistance zones would significantly improve the bullish outlook, while rejection could signal renewed consolidation or corrective pressure.
Golden Crossover Remains Bullishly Intact on the Daily Chart
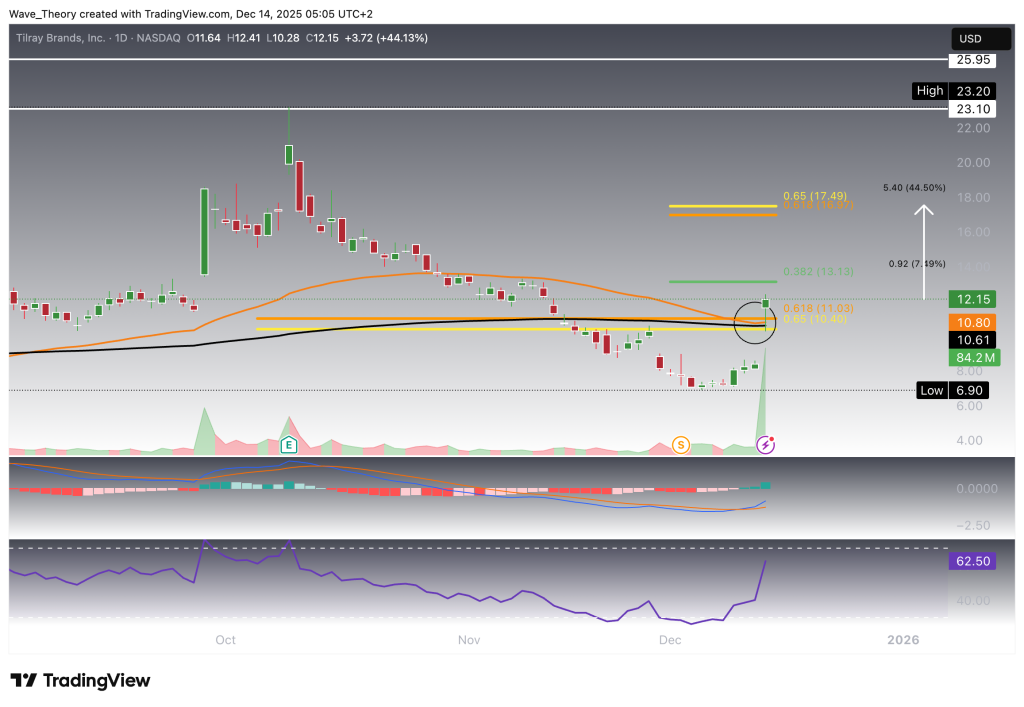
On the daily chart, Tilray briefly threatened to form a death cross, but the recent upside acceleration has preserved the golden crossover, keeping the short- to medium-term trend bullishly confirmed. Momentum indicators support this view: the MACD lines remain bullishly crossed, and the MACD histogram is trending strongly higher, signaling accelerating bullish momentum. Meanwhile, the RSI is approaching overbought territory, though it has not yet produced any bearish signals.
Should Tilray sustain its upward trajectory and continue advancing toward the next Fibonacci resistance levels, this setup implies upside potential ranging from approximately 7.5% up to 44.5%, depending on the extent of the move.
Death Cross Ermerges on the 4H Chart
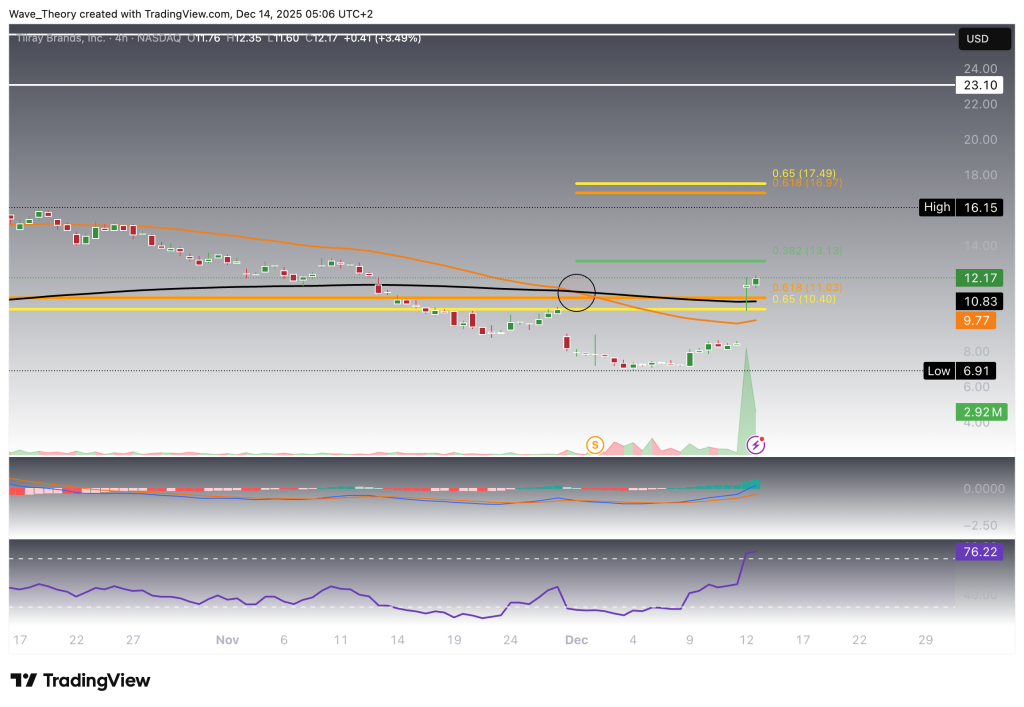
On the 4-hour chart, Tilray’s EMAs have already formed a death cross, confirming a bearish short-term trend from a moving-average perspective. However, this is contradicted by momentum indicators. The MACD lines remain bullishly crossed, while the MACD histogram is trending strongly higher, signaling accelerating bullish momentum beneath the surface. Meanwhile, the RSI is moving in overbought territory, yet it does not display any bearish divergence, suggesting that upside momentum has not yet meaningfully deteriorated.
Overall, despite the bearish EMA structure on the 4H timeframe, the strength in momentum indicators implies that further short-term upside remains possible before any broader consolidation or pullback materializes.
Tilray (TLRY) – Technical Summary & Key Levels
Tilray has undergone extreme volatility, surging from $3.51 to $23.10, followed by a deep correction to $6.90, and has since staged a strong rebound to $12.15, effectively doubling from its recent lows.
Higher Timeframes (Monthly / Weekly):
- Long-term structure remains constructive but fragile.
- MACD lines are bullishly crossed, supporting a broader recovery narrative, though the MACD histogram has recently turned bearish, signaling waning momentum.
- RSI remains neutral, offering no directional confirmation.
- Key resistance levels are located at $13.13 and $17.50, both significant Fibonacci retracement levels.
Daily Chart:
- The EMA golden crossover remains intact, narrowly avoiding a death cross, confirming a bullish short- to medium-term trend.
- MACD is bullish, with a rising histogram, while RSI is approaching overbought territory, suggesting strong momentum but increasing short-term risk.
- Upside potential toward resistance implies a ~7.5% to ~44.5% move, depending on breakout strength.
4H Chart:
- Short-term trend is technically bearish, with EMAs forming a death cross.
- Momentum contradicts the EMA structure: MACD remains bullish with a strongly rising histogram, and RSI is overbought but without bearish divergence, leaving room for further upside before exhaustion.
Key Levels to Watch
- Support: $6.90 and $3.51
- Resistance: $13.13 → $17.50
- Trend Invalidation (Bullish): Sustained break above $17.50
- Risk Zone: Loss of $10.40 would weaken the recovery structure
Overall Outlook:
Tilray remains in a high-volatility recovery phase. While momentum favors continued upside in the near term, major Fibonacci resistances overhead and mixed higher-timeframe signals suggest that breakouts must be confirmed decisively to avoid another sharp retracement.
- Check out our free forex signals
- Follow the top economic events on FX Leaders economic calendar
- Trade better, discover more Forex Trading Strategies
- Open a FREE Trading Account
- Read our latest reviews on: Avatrade, Exness, HFM and XM
Related Articles

Sidebar rates
Related Posts
