Paramount Skydance Corp experienced a significant speculative surge of over 900% between 2020 and 2021, but has since collapsed to around $10.
The stock recently rallied 109% from its low but faced rejection at key resistance levels, reinforcing a broader bearish trend.
Technical indicators show weakening momentum, with MACD signals deteriorating and the long-term EMAs confirming a downtrend.
Key support is at $13.5, and a break below this level could lead to a decline towards the $10 support zone.
Paramount Skydance Corp (NASDAQ: PSKY) saw an exceptional speculative surge between 2020 and 2021, rallying over 900% in a parabolic move — a form of price action that is historically unsustainable and often marks the terminal phase of a broader market cycle rather than the beginning of a lasting secular uptrend.
Impulse Wave: Paramount Stock Surges 109% in Two Months, Rejected at Key Resistance
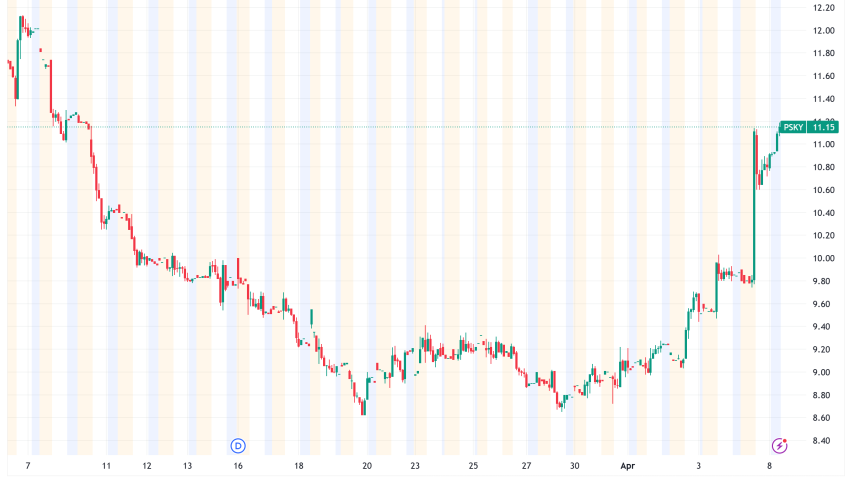
Paramount stock collapsed from its all-time high near $102 to approximately $10 — a level that previously marked the structural low preceding the explosive 910% rally between 2020 and 2021. This zone once again acted as a demand area, where price established a bottom and initiated a sharp counter-trend impulse, rallying 109% in just two months.
However, the rebound stalled swiftly at the 50-month EMA, with price facing firm rejection near $18.7, reinforcing the broader bearish structure. Momentum indicators continue to deteriorate: the MACD histogram has been printing consecutively lower bearish bars over the past three months, and the MACD lines are approaching a potential bearish crossover. The RSI remains in neutral territory, offering no bullish divergence to challenge the prevailing trend. Structurally, the long-term EMAs remain decisively bearish, with a death cross already in place since 2022. This confirms the long-term downtrend bearishly.
From a trend-validation perspective, the downtrend remains intact unless Paramount can reclaim key Fibonacci resistance levels. A sustained breakout above the 0.382 Fibonacci retracement at approximately $45, followed by a decisive move through the Golden Ratio resistance near $70, would be required to invalidate the dominant bearish trend. Until then, the recent advance is best classified as a corrective impulse within a broader downtrend rather than the start of a new secular upcycle.
Paramount Skydance Corp
Will Paramount Stock Now Break Golden Ratio Support?
On the weekly timeframe, the trend remains firmly bearish, with the EMAs maintaining a death cross that confirms downside dominance in the mid-term. Momentum continues to weaken: the MACD lines are bearishly crossed, and the MACD histogram has been printing consecutively lower bearish bars for a prolonged series of weeks. Meanwhile, the RSI trades in neutral territory, reflecting a lack of bullish momentum and no divergence capable of challenging the prevailing trend.
At present, Paramount stock is holding the Golden Ratio Fibonacci support near $13.5. A decisive bearish break below this level would open the door for a move back toward the $10 support zone, effectively invalidating the recent upward impulse. Conversely, should price manage to stabilize and bounce from current levels, the next significant Fibonacci resistances are located at $16 and $18. The $18 region is further reinforced by the 200-week EMA, making it a technically dense resistance zone likely to cap any short-term recovery.
Paramount Skydance Corp
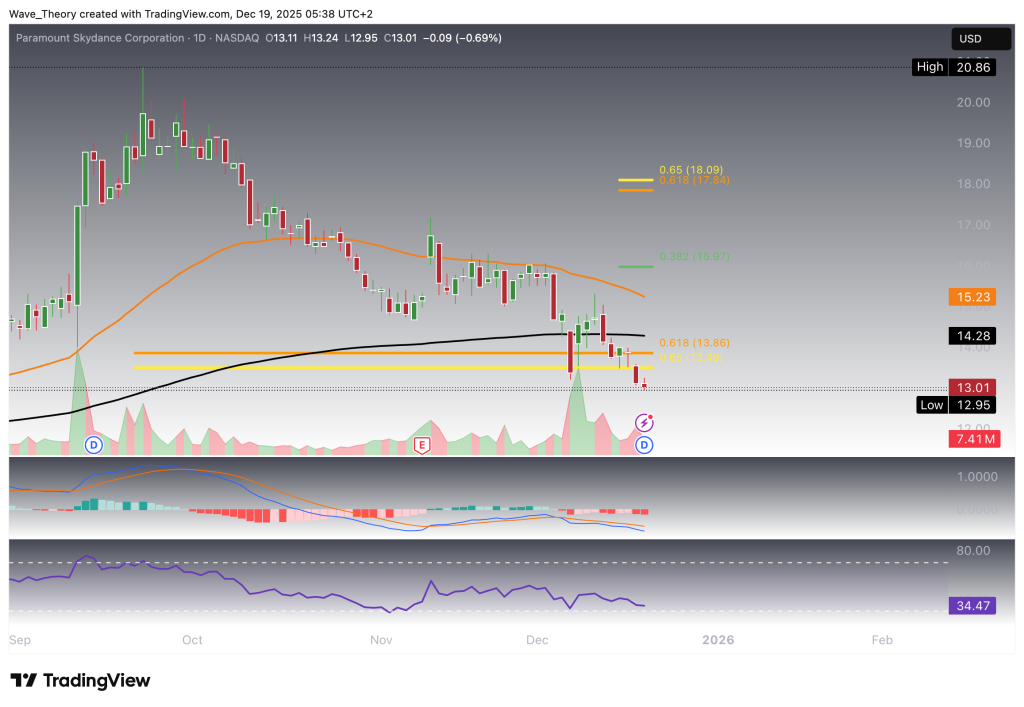
Mixed Signals on the Daily Chart
On the daily timeframe, technical signals are mixed. The EMAs remain bullishly crossed, confirming a bullish short- to medium-term trend structure. However, momentum is beginning to weaken. The RSI is trading in neutral territory and is drifting lower, with the potential to approach oversold conditions if downside pressure persists.
At the same time, momentum indicators are flashing caution: the MACD lines are bearishly crossed, and the MACD histogram has been ticking bearishly lower since yesterday. This divergence between trend structure (bullish EMAs) and momentum (bearish MACD) suggests growing downside risk and increases the probability of a corrective move within the prevailing short-term uptrend.
Paramount Skydance Corp
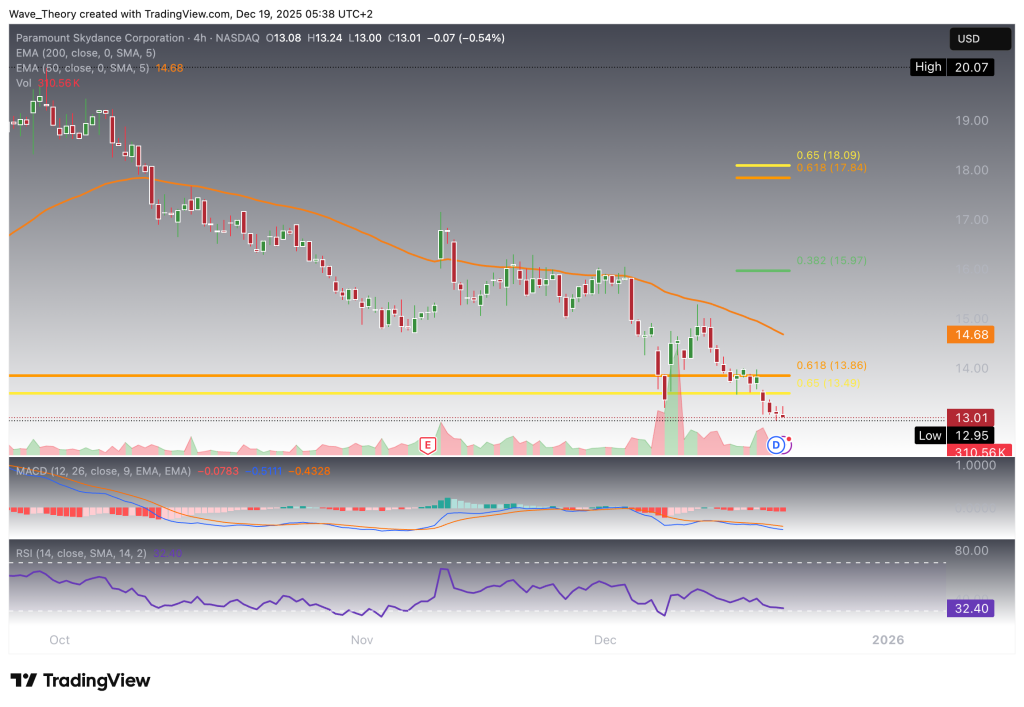
Similar Outlook on the 4H Chart
The 4H timeframe largely mirrors the daily setup. The MACD lines are bearishly crossed, and the MACD histogram is trending lower, confirming persistent downside momentum. At the same time, the RSI shows early potential for a bullish divergence, which could offer short-term upside relief if confirmed.
However, despite this tentative bullish signal, overall price action remains fragile. The structure favors a bearish resolution, with an increased likelihood of a decisive break below the Golden Ratio support and a continuation of the broader downtrend. This view is reinforced by repeated rejections at the 50-period 4H EMA, which has acted as dynamic resistance around $14.7 over the past several weeks.
Paramount Skydance Corp
Paramount Stock – Technical Summary & Key Levels
Paramount remains structurally bearish across the higher timeframes despite a sharp 109% counter-trend rally from the $10 support zone. The long- and mid-term trends are confirmed bearish by persistent EMA death crosses and weakening momentum, with MACD signals deteriorating on both weekly and daily charts. The recent impulse appears corrective rather than trend-reversing.
Key Levels
Major Support: $13.5 (Golden Ratio)
Critical Downside Target: $10 (structural support / cycle low)
Unless price decisively reclaims the $16–$18 resistance zone, downside risk remains dominant, with a break below $13.5 likely triggering a move back toward $10.
Konstantin Kaiser comes from a data science background and has significant experience in quantitative trading. His interest in technology took a notable turn in 2013 when he discovered Bitcoin and was instantly intrigued by the potential of this disruptive technology.